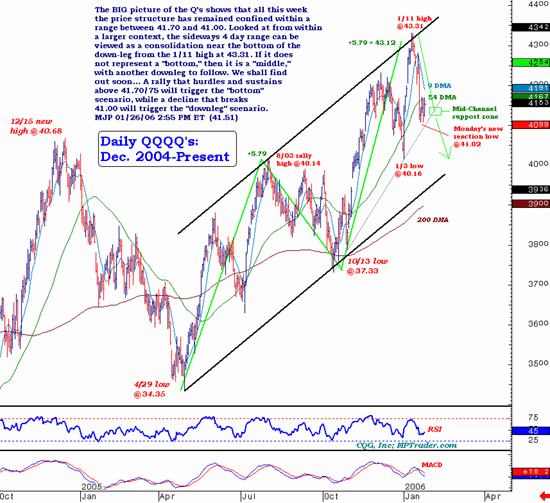
The big picture of the Q's shows that all this week the price structure has remained confined within a range between 41.70 and 41.00. Looked at from within a larger context, the sideways 4-day range can be viewed as a consolidation near the bottom of the down-leg from the January 11 high at 43.31. If it does not represent a "bottom," then it is a "middle," with another downleg to follow. We shall find out soon. A rally that hurdles and sustains above 41.70/75 will trigger the "bottom" scenario, while a decline that breaks 41.00 will trigger the "downleg" scenario.
MJP 01/26/06

Mike Paulenoff is a 25-year veteran of the financial markets and author of MPTrader.com, a real-time diary of his E-mini S&P and QQQQ technical analysis and trading alerts. For more of Mike Paulenoff, sign up for a FREE 30-Day Trial to his E-Mini/Index Futures diary, or try his QQQ Trading Diary.