| Debt Be Not Proud |
| By John Mauldin |
Published
09/10/2012
|
Currency , Futures , Options , Stocks
|
Unrated
|
|
|
|
Debt Be Not Proud
"In the financial markets, the current economic cycle is still often viewed as if it is comparable to the far shorter cycles we have experienced since World War II. If that was indeed the case, the solution would be to implement fiscal and monetary stimuli now until lending to the private sector and thereby growth rise substantially. However, what is being overlooked is that the total debt/GDP ratio has risen so sharply over the past 75 years that the limit has probably been reached.
"That would mean that the governments and central banks can no longer create high growth; at best they can prevent growth from sliding fast. In addition, the drawbacks for central banks of opening the liquidity taps further are growing, while the effectiveness of the action is waning. Therefore, although we anticipate the Fed to embark on additional easing measures, we believe they will be disappointing in scope and effectiveness. For the ECB, maintaining the EMU and the euro is more important. To achieve that, interest rates in Italy and Spain have to be rapidly reduced. Nevertheless, the measures the ECB recently announced will achieve no more than creating a degree of calm in the financial markets, unless Spain and Italy make substantial structural reforms to their economies. However, there is great resistance to those reforms."
- ECR Research
The unemployment numbers came out yesterday, and the drums for more quantitative easing are beating ever louder. The numbers were not all that good, but certainly not disastrous. But any reason will do, if what you want is more stimulus to boost the markets ever higher. Today we will look first at the employment numbers, because deeper within the data is a real story. Then we look at how effective any monetary stimulus is likely to be.
I am in Carlsbad today at the Casey Research Investment Conference. I got to hear my good friend Dr. Lacy Hunt give a presentation on monetary policy, and he was on fire. I think I persuaded David Galland of Casey Research to give me access to the speech for you, when it is available, and you will want to listen to it. It was one of the best speeches I have heard on current monetary and fiscal policy in a very long time. In this week's letter I will touch on a few of his points and make a few of my own. Let's jump right in, as there is a lot to cover.
How Down Can Be Up If You Create the Rules
The nonfarm payroll numbers showed an increase of just 96,000 jobs in August. This was almost dead on the average for the last six months, which is 97,000, down from 205,000 the previous six months, echoing the pattern of last year and suggesting the numbers for the next two months will be soft as well, just prior to the election.
Almost all of the growth is in the birth/death number, which this month was 87,000 new jobs. For new readers, this is the number that the Bureau of Labor Statistics creates to account for new businesses created that were not part of the employment survey. The BLS surveys established businesses to get the employment data (thus this survey is called the establishment survey). Since, almost by definition, they can't survey new businesses, and net new businesses are one of the more important parts of the employment picture, BLS makes an estimate based on historical data. Then over time they revise the overall numbers. The direction of the revisions is very important, as it tells us much about the underlying employment trends.
The revisions were all negative this time. That suggests to me that this month's birth/death number is probably higher than it should be, and over time it will get revised down as well. Ugh.
Looking at the data, we find that 28,000 jobs were created in the bar and restaurant business. Those are not exactly high-paying jobs. My anecdotal observation is that more than a few college graduates are taking those jobs.
The average earnings data was flat for the month, as the year-over-year number fell to a +1.7%, which is below inflation. Workers are falling behind. Worse, hours worked fell by one-tenth of an hour. That doesn't seem like a lot, but when you add the hours up, that one-tenth is the equivalent of several hundred thousand jobs, in terms of actual pay, which is of course a drag on consumer spending.
We are down 4.7 million jobs from the pre-recession peak. At less than 100,000 jobs added per month, it would take four more years just to get back to where we were five years ago. Which would not appreciably reduce the unemployment rate, due to the growth in population.
All that was disappointing, but not anything we should be surprised by. No, the thing that caused me to do a double-take was the drop in the unemployment rate from 8.3% to 8.1%. How can only 96,000 new jobs cause a drop in the unemployment rate of 0.2%? That is really a rather large number and should have required closer to 250-300,000 new jobs. In addition, the population actually grew by 213,000.
"The number of unemployed fell by 250,000, and the unemployment rate fell by 0.2 to 8.1%. But those declines were largely the function of labor force withdrawal. Flows data confirm this suspicion: 195,000 went from employed to not in labor force, and 226,000 from unemployed to not in labor force, both very high numbers by historical standards. The number classed as not in labor force but wanting a job rose by 437,000 to 7.0 million, or 2.9% of the population, the highest of the Great Recession/Tepid Recovery cycle." (The Liscio Report)
The U3 unemployment rate has dropped from 9.1% last August to 8.1% this August. How does that square with numbers in the real world? The working-age population has risen by 3.7 million people, and the number of employed people (including part-time) has increased by 2.3 million. How can an increase in the number of people that logically seem unemployed translate into a reduction in the unemployment rate?
To reduce the unemployment rate, the trick is to reduce the number of people in the work force by significantly more than the number of new jobs. Under the rules, 368,000 people were removed this month from the labor force. The labor force is made up of those who are either employed or unemployed, but you are not considered unemployed if you have not looked for a job in the last four weeks, or are in school or…
Now, here is something Lacy told me today in a private conversation, as we were talking about the rather large drop in the labor force, and it surprised me. He noted that you are not considered to be in the labor force is you have not been considered unemployed during the last year. (I must admit I cannot find that on the BLS website. And at 3 AM in the morning, it would be rude to call his room. I will confirm this later today and note that to you next week if I got the details wrong.)
Here is the interesting thing. It used to be that you were in the labor force if you had been looking for work sometime in the last four years, but that was changed to one year in the latter Clinton years. If we used that older and to my mind more reasonable standard, the unemployment rate would be at least 1% higher and perhaps a lot more. I call the old standard more reasonable because it counts discouraged workers who would take a job if they thought they could find one.
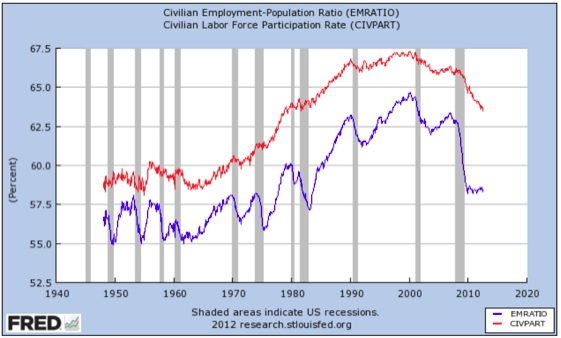
Look at this graph from the St. Louis Fed FRED database. The labor force participation rate is in red and the employment-to-population ratio is in blue. The employment-to-population ratio is down to where it was in the late '70s. The participation rate is down to 63.5%, roughly where it was some 30 years ago.
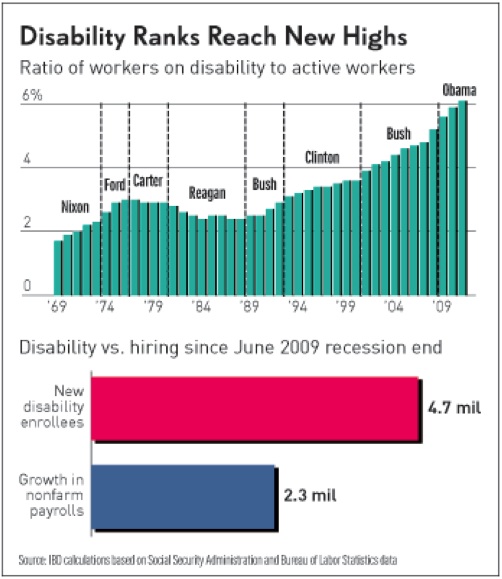
Note that if you are on disability you are not considered to be in the labor force. As of April we have added 5.4 million people to the disability rolls since the beginning of 2009. This is several million above the previous trend. There are now almost 9 million on disability. There are many who drop off each year, but many of them are going from disability to Social Security.
"As the Congressional Budget Office explains: "When opportunities for employment are plentiful, some people who could quality for [disability insurance] benefits find working more attractive ... when employment opportunities are scarce, some of these people participate in the DI program instead."
"The explosive growth in disability enrollment also 'helps explain some of the drop in the labor force participation rate,' noted economist Ed Yardeni on his blog." (Investor's Business Daily)
In 1992, there was one person on disability for every 35 workers. It is now about one for every 16 workers.
If disability had stayed at the pre-recession growth trend, unemployment would be at least 1% higher, and perhaps as much as 2%.
Bottom line is that true unemployment is closer to 10% and perhaps significantly more. We just don't know. Underemployment is still in the range of 16%. And that does not count people who have a job for which they are far overqualified and who are making much less money than they would if they could find a job in their chosen field. I should note to all those people who think I am being overly pessimistic that John Williams at Shadow Stats, who uses the US government methodology from 30 years ago, tells us that U-6 unemployment is around 23%. The difference is in how you create the model. The feds keep changing the rules, and it should be no surprise that with each new rule the number of people officially counted as unemployed drops. And if you can't find a job, whether you are officially unemployed or not, it's no fun.
The Fed to the Rescue?
This ongoing unemployment problem is increasing the pressure on the Fed to "do something." But is more quantitative easing the answer? I am going to quote from three pieces of research brought to my attention by Lacy Hunt this afternoon (directly from his PowerPoint). This all fits hand in glove with the report I highlighted last week from William White, which was on the Dallas Federal Reserve website.
The upshot of these difficulties is that Fed QE policy has lost its effectiveness and may start to be part of the problem. And thatthe solution should focus on controlling government debt.
The Correlation Between Government Size and Growth
"Government Size and Growth: A Survey and Interpretation of the Evidence." Andreas Bergh, Research Institute of Industrial Economics (IFN) Lund University and Magnus Henrekson, Research Institute of Industrial Economics (IFN) Lund University. Journal of Economic Surveys, April 2011. Page 2, http://journalistsresource.org/wp-content/uploads/2011/08/Govt-Size-and-Growth.pdf.)
The first study we'll look at shows a clear inverse correlation between the size of government and growth. This really confirms common sense, as government only takes from private production to fund its spending. And while one can make a case that some government spending is productive, much of government spending, including transfer payments, does not contribute to that case. That is not the same as arguing that those transfer payments should not be made. It simply points out that there is a cost to society to increase the size of government. And that cost is in jobs, hence the ugly employment numbers.
That being said, the authors note that correlation is not causation and that there are other explations for countries with high taxes and higher growth rates. I provide a link to the study for those who are interested, and we may explore those questions in depth in a later letter. Quoting:
"Any conflict between the size of government and economic growth is largely explained by variations in definitions and the countries studied. Bergh and Henrekson write, 'An alternative approach – of limiting the focus to studies of the relationship in rich countries, measuring government size as total taxes or total expenditure relative to GDP and relying on panel data estimations with variation over time – reveals a more consistent picture...' Bergh and Henrekson find a 'significant negative correlation.' Specifically, 'an increase in government size by 10 percentage points is associated with a 0.5% to 1% lower annual growth rate.'" (bold emphasis mine)
Debt Be Not Proud
Cristina Checherita and Philipp Rother, "The Impact of High and Growing Government Debt on Economic Growth, An Empirical Investigation for The Euro Area," European Central Bank working paper no. 1237, August 2010. http://www.ecb.int/pub/pdf/scpwps/ecbwp1237.pdf
This ECB paper suggests that governments need to get their fiscal houses in order.
"Checherita and Rother investigated the average effect of government debt on per capita GDP growth in twelve euro area countries over a period of about four decades beginning in 1970. They confirm and extend the finding by Reinhart and Rogoff in their 2010 NBER paper. A government debt to GDP ratio above the turning point of 90-100% has a 'deleterious' impact on long-term growth. In addition, they find that there is a non-linear impact of debt on growth beyond this turning point. A non-linear relationship means that as the government debt rises to higher and higher levels, the adverse growth consequences accelerate. Results across all models 'show a highly statistically significant non-linear relationship between the government debt ratio and per-capita GDP for the 12 pooled euro area countries included in their sample.'
"Moreover, confidence intervals for the debt turning point suggest that the negative growth rate effect of high debt may start from levels of around 70-80% of GDP. Due to these findings, Checherita and Rother write this '…calls for even more prudent indebtedness policies.' Checherita and Rother make a substantial further contribution by identifying the channels through which the level and change of government debt is found to have an impact on economic growth: (1) private saving, (2) public investment, (3) total factor productivity and (4) sovereign long-term nominal and real interest rates."
Debt Overhangs: Past and Present
Carmen M. Reinhart, Vincent R. Reinhart, Kenneth S. Rogoff, National Bureau of Economic Research, working paper 18015. http://www.nber.org/papers/w18015
Then Lacy reviews recent work by our old friends Ken Rogoff and Carmen Reinhart (who wrote the seminal work This Time Is Different). It is further acknowledgement that excessive government debt will retard growth. Again quoting from his PowerPoint:
"Post 1800 Episodes Characterized by Public Debt to GDP Levels Exceeding 90% for At Least Five Years.
"Consistent with other more recent research, the authors confirm that public debt overhang episodes are associated with growth over one percent lower than during other periods. ... duration of the average debt overhang episode across all 26 episodes lasted an average of 23 years.... Growth effects are significant even in the many episodes where debtor countries were able to secure continual access to capital markets at relatively low real interst rates. That is, growth-reducing effects of high public debt are apparently not transmitted exclusively through high real interest rates.
"The long duration belies the view that the correlation is caused mainly by debt buildups during business cycle recessions. The long duration also implies that cumulative shortfall in output from debt overhang is potentially massive.
"At the end of 23 years... Real GDP is 24 percent lower than for the baseline. It is not exactly what T.S. Eliot had in mind when he wrote 'This is the way the world ends, Not with a bang but a whimper' but the general thrust appears to be applicable to the debt-without-drama damages.
"This research documents the first systematic evidence on the association between high public debt and real interest rates. They write: 'Contrary to popular perception, we find that in 11 of the 26 debt overhang cases, real interest rates were either lower or about the same as during the lower debt/GDP years. Those waiting for financial markets to send the warning signal through higher interest rates that government policy will be detrimental to economic performance may be waiting a long time.'"
Should the Fed Give Us QE3?
There seems to be a clear consensus (from the dozen or so items I have read) that the Fed will now give us QE3 at its meeting next week. I do not doubt that more QE is in the works, but I sincerely hope they wait until after the election. To my mind, another round of QE will not produce all that much, though it may possibly make the stock market happy.
It will not stimulate spending or increase the need for more loans or make it easier to buy a house. Rates are already low, and there is excess liquidity in the system. While I acknowledge that the propensity of a central banker is to do something (God forbid that a recovery should happen while they did nothing, so they couldn't take credit for it!), it is unseemly to do so right before a presidential election. There is nothing in this employment report that is any different from what we knew months ago.
I can see no reason not to wait until November. The building is not on fire. Additional QE today is like pouring water on a drowning man.
Please note: I have been consistent on this issue for decades. The Fed must not be seen to be political in any way prior to a presidential election. Caesar's wife and all that stuff. I would be fine with QE after a Lehman-type incident if it happened right before an election, but we do not have a Lehman issue. The economy is still growing, if slowly. The problem is not a monetary problem and cannot be solved by the Fed. The future direction of the country and the shape of the fiscal deficit will be decided in November.
Next week we'll take a look at the election itself, after some time to assess the convention bounces and what this election really means. Let me give you a teaser. I am not worried at all that either the Obama budget or the Romney budget will be enacted as proposed, because the chances are about zero of either being passed. The issue is the direction of the compromise, and on that seeming nuance, the economic future of the republic hangs. Stay tuned.
John Mauldin is president of Millennium Wave Advisors, LLC, a registered investment advisor. Contact John at John@FrontlineThoughts.com.
Disclaimer
John Mauldin is president of Millennium Wave Advisors, LLC, a registered investment advisor. All material presented herein is believed to be reliable but we cannot attest to its accuracy. Investment recommendations may change and readers are urged to check with their investment counselors before making any investment decisions.
|
|


 Free Festival of Traders Videos