| Growth Stocks Leading The Way |
| By Price Headley |
Published
05/31/2011
|
Currency , Futures , Options , Stocks
|
Unrated
|
|
|
|
Growth Stocks Leading The Way
The recent trading week was a bearish one, though just barely. The bulls fought back the last three days of last week, but it just wasn’t quite enough to get the market back in the black. It was the fourth losing week in a row. The good news is at least it ended in a positive note, even if on weak volume. The S&P 500 found support precisely where it needed to, prompting that rebound.
Will that be enough to get the broad market back over another key hurdle? We’ll explore that micro idea below. First though, let’s start our top-down approach with the macro picture of last week’s and this week’s economic data.
Economic Calendar:
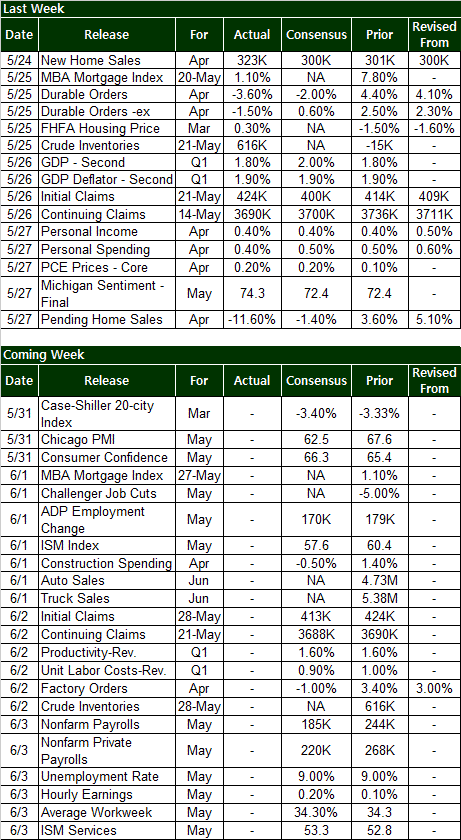
* The real estates picture was a mixed one last week. New home sales improved to a rate from just above a record low of 300K per year to a still-very-low 323K per year, while pending homes sales fell 11.6%. Home prices were up 0.3% -- effectively flat.
* Income-wise, workers made 0.4% more in April, though they spent 0.4% more as well. Thing is, there are still a lot of people out of work not making any real income. Continuing claims fell from 3.73 million to 3.69 million two weeks ago, but last week, new unemployment claims moved up from 414K to 429K.
* Durable orders were a disaster on the surface, plunging 3.6% in April, and falling 1.5% not counting transportation orders. BUT, what can’t be ignored here is that the dip is just a partial offset of the prior month’s growth of 4.4% and 2.5%, respectively.
Economic Calendar

It’s going to be a stunningly busy week this week, and all compacted into four days instead of five. There’s no way we can preview all of it, so here are the biggies to watch for.
* Tuesday: The Case-Shiller Index should confirm last week’s dip in home prices, and the Conference Board’s consumer confidence level should be way down (despite the Michigan Sentiment Index improving for May).
* Wednesday: A huge day for jobs and job cuts. We should see 170K new jobs added (same as last months). No word yet on the job-cuts change from Challenger, though the government number comes out Friday. Car and truck sales are out too.
* Thursday: Look for only a slight improvement in unemployment claims; and a slight dip (-1.0%) in April’s factory orders.
* Friday: Another huge day for the employment picture. The unemployment rate should hold steady at 9.0%, but nonfarm payroll growth – the government’s figure – should slump from 244K to 185K.
Stock Market & Volatility:
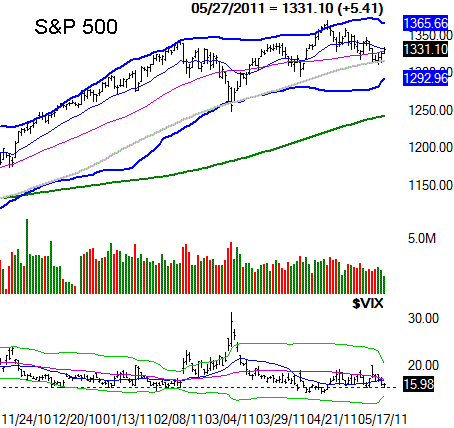
All told, the S&P 500 (SPX) (SPY) only lost 2.17 points last week (-0.16% -- an amount that can be dismissed). Perhaps more important though, the bulls were working hard in the latter half of last week after making a floor out of a key support line we alluded to above.
It’s the 100-day moving average line (gray), currently at 1316, but at 1315 on Wednesday when the market started to walk higher instead of lower after hitting a low of 1311.80 that session. Since that low, we’ve seen nothing but bullish progress.
Could this be the end of the weakness and the beginning of bullishness again? Anything’s possible, but there’s more working against the market than for it.
One of those tripwires is simply the fact that despite the recent gains, the SPX still was stopped at the 20-day moving average line. Until that hurdle at 1332.76 is cleared [the index closed at 1331.10 in Friday], then the buying effort means little.
The calendar is also going to present a problem…. the whole ‘sell in May and go away’ thing. Though the cliche is slightly misleading, there’s still something to it – tepidness around this time of year. Even ‘not bearish doesn’t inherently mean ‘bullish’, especially when the broad market s still sitting on 25% gain since last August that has yet to see a meaningful correction.
Last but not least, the CBOE Volatility Index (VIX) (VXX) (VXZ) is back at ‘creepy’ low levels again, though this is becoming less and less important as the market has been able move higher and lower without the VIX even budging of late. That said….
Though the support line at 15.50 (dashed) for the VIX may not be poised to have much of an impact now, the lower Bollinger – currently at 13.81 – is sneaking up, and may end up finally forcing the VIX higher, and stocks lower. That’s how the February pullback unfolded, largely out of nowhere. Of course, that lower band line was hit by the VIX a few times in December, and wasn’t a problem from stocks then. So, the VIX’s lows Bollinger band alone may not be enough to trip stocks up now. It is something to watch though. Just watch it in conjunction with other clues.
SPX & VIX Daily Chart

No need to dissect it, but just for some visual perspective, we do want to add a weekly chart of the S&P 500. It’s here we can see how well the index pushed up and off the 100-day line, but also how overbought the market still is after the runup in the last 1/3 of last year. Also, it’s with this chart we can see how long the VIX has been becoming a coiled spring just waiting to unwind.
SPX & VIX Weekly Chart

Bottom line – If the bulls are going to do this, they need to do it right out of the gate Tuesday and go ahead and get over the hump of the 20-day moving average line. If that can happen, the S&P 500 is apt to make another run on the upper Bollinger band at 1365 (our current and conditional upside target).
Even just the slightest slip-up early this week, however, will likely open the door to all the market’s potential problems and force a retest of the lower band line at 1293.
Almost needless to say, Tuesday is going to be a very important day.
Market Cap/Style Comparisons
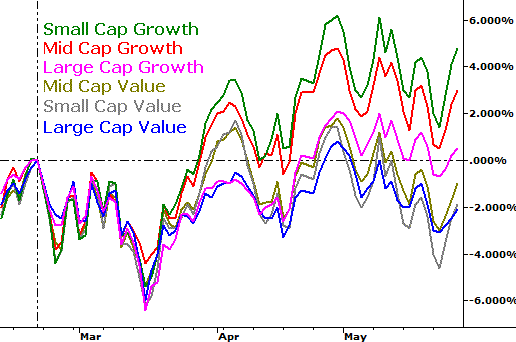
Just to keep things fresh, this week we’re going to skip the look at the sector results and instead show you how the different market cap groups – broken down further into style (growth and value) groups are doing.
Read ‘em and weep…the conclusions are clear. Growth is good, and value stinks (but only until further notice). Mid caps also seem to (still) have something a little extra.
Market Cap/Style Performance, since February 18

Price Headley is the founder and chief analyst of BigTrends.com.
|
|