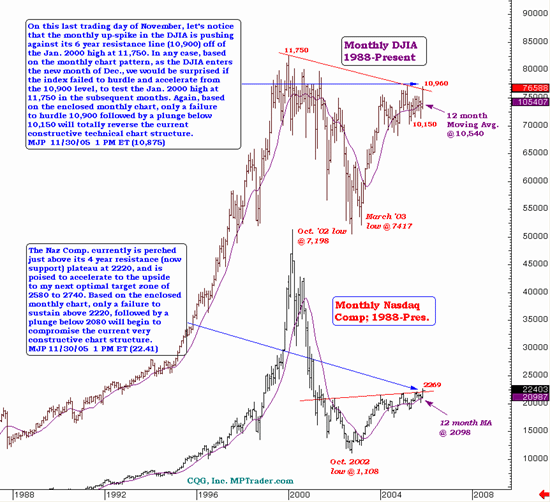
On this last trading of November, let's notice that the monthly up-spke in the DJIA is pushing against its 6-year resistance line (10,900) off of the January 2000 high at 11,750. In any case, based on the monthly chart pattern, as the DJIA enters the new month of December, we would be surprised if the index failed to hurdle and accelerate from the 10,900 level to test the January 2000 high at 11,750 in the subsequent months. Again, based on the monthly chart, only a failure to hurdle 10,900 followed by a plunge below 10,150 will totally reverse the current constructive technical chart structure.
MJP 11/30/05

Mike Paulenoff is a 25-year veteran of the financial markets and author of MPTrader.com, a real-time diary of his E-mini S&P and QQQQ technical analysis and trading alerts. For more of Mike Paulenoff, sign up for a FREE 30-Day Trial to his E-Mini/Index Futures diary, or try his QQQ Trading Diary.