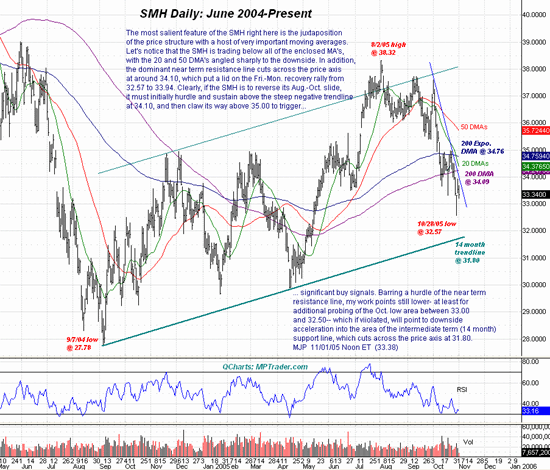
The most salient feature of the SMH right here is the juxtaposition of the price structure with a host of very important moving averages. Let's notice that the SMH is trading below all of the enclosed moving averages, with the 20- and 50-day moving averages angled sharply to the downside. In addition, the dominant near-term resistance line cuts across the price axis at around 34.10, which put a lid on the Friday-Monday recovery rally from 32.57 to 33.94. Clearly, if the SMH is to reverse its August-October slide, it must initially hurdle and sustain above the steep negative trendline at 34.10, and then claw its way above 35.00 to trigger significant buy signals. Barring a hurdle of the near-term resistance line, my work points still lower, at least for additional probing of the October low area between 33.00 and 32.50, which if violated, will point to downside acceleration into the area of the intermediate-term (14 month) support line, which cuts across the price axis at 31.80.
MJP 11/01/05

Mike Paulenoff is a 25-year veteran of the financial markets and author of MPTrader.com, a real-time diary of his E-mini S&P and QQQQ technical analysis and trading alerts. For more of Mike Paulenoff, sign up for a FREE 30-Day Trial to his E-Mini/Index Futures diary, or try his QQQ Trading Diary.