| Long-Term Charts Are Near A Crucial Juncture |
| By Price Headley |
Published
10/14/2009
|
Futures , Options , Stocks
|
Unrated
|
|
|
|
Long-Term Charts Are Near A Crucial Juncture
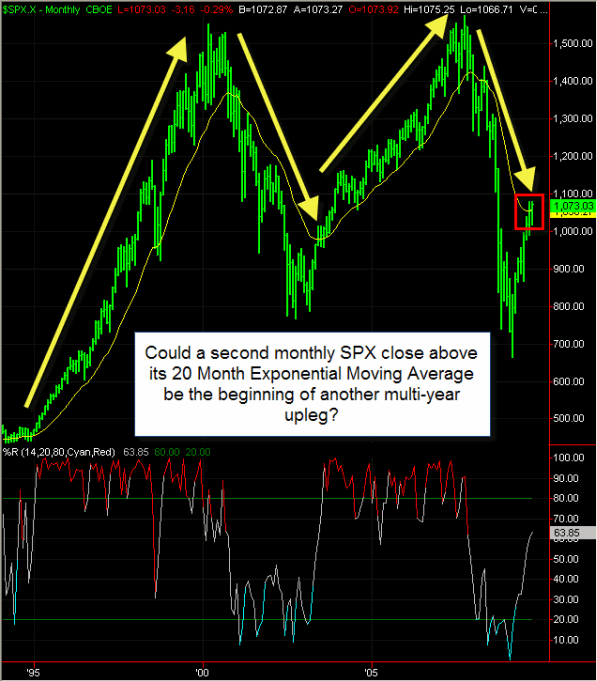
Stepping back to see the forest can often help in your long-term investing and asset allocation. With that in mind, take a look at the S&P 500 Index Monthly Chart below. This chart covers about 15 years of data. You can see the large swings and clear bull and bear markets we have had over this time frame, all of which lasted multiple years. Depending on your technical viewpoint, it also forms famous patterns such as Double Top, 'M' Shape, or even a Reverse Head and Shoulders.
The yellow trendline overlaid on the chart is the 20-month exponential moving average of the SPX. You can see that this simple tool has been extremely good at showing the big picture underlyling market trend. There have been four major market stages in this time period, and the 20-month exponential moving average was an accurate guideline of each trend. Following this simple trendline as to when to be long (and short) the market would have destroyed virtually any "Buy and Hold" or Index Fund performance over the years.
There have been a few false one month closes above or below this line, but any two monthly consecutive closes provided an indication of a long-term trend switch. This month, October, would mark the second consecutive monthly close above this moving average. It is currently around 1056.44 -- it barely closed above this trendline in September, and currently we are about 1.7% above this barometer.
SPX Monthly Chart

Would a second monthly close above the 20-month exponential moving average on the SPX give an "all-clear" buy signal for a multi-year bull market? I certainly wouldn't go that far, but the power of this long-term trend cannot be denied. There are fundamental factors and other technical indicators to consider. For instance, I have written previously that a perfect 50% Fibonacci Retracement from the 2007 weekly highs to 2009 weekly lows would come in about 1121on the SPX. So I will be certainly be watching closely when or if we approach that level as potential resistance. But those of you who have been sitting on the sidelines in cash, money markets, T-Bills, and the like would be wise to consider the opportunity cost of missing a potential multi-year bull market.
Price Headley is the founder and chief analyst of BigTrends.com.
|