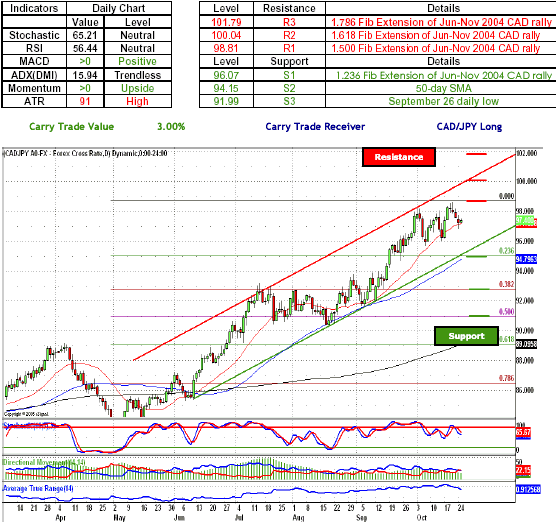
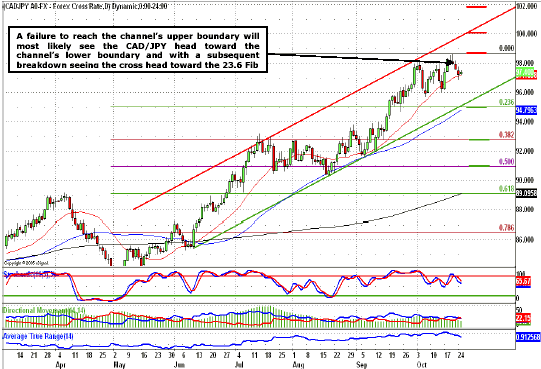
CAD/JPY - Canadian dollar bulls remained confined to a narrow trading range that dominated the price action for the past month. A reversal from these levels will most likely see the cross test the Loonie bids around 96.67 a level marked by the 20-day SMA, with subsequent move to the downside will most likely see the cross head lower and test the Canadian dollar defenses around 94.15, a level established by the 50-day SMA, thus seeing the CAD/JPY break below the psychologically important 95.00 handle. A further move to the downside will most likely see the Japanese yen longs push the cross toward 91.99, a Canadian dollar position established by the September 26 daily low. Indicators remain in favor of the Canadian dollar traders with both MACD and momentum indicator above the zero line, while neutral oscillators give either side enough room to maneuver.
Key Levels & Technical Indicators

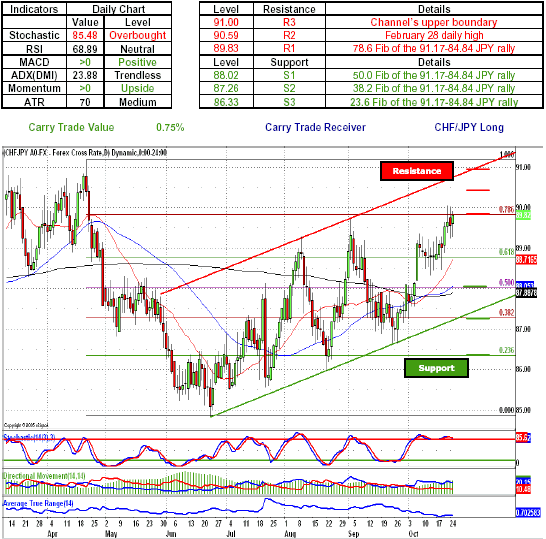
CHF/JPY - Swiss Franc longs made another attempt to push the cross above the psychologically important 90.00 handle, but failed to gain momentum as the level is being defended by the key 78.6 Fib of the 91.17-84.84 of the JPY rally at 89.83. As yen bulls launch a counterattack against the Swissie bulls and push the cross toward the 88.71, a level marked by the 61.8 Fib of the 91.17-84.84 of the JPY rally, a break below the channel's lower boundary will most likely see the yen longs make their way toward the 88.02, a 50.0 Fib of the 91.17-84.84 of the JPY rally. A sustained momentum to the downside will most likely see JPY bulls taking on the CHF defenses around 86.33, a Swiss Franc defensive line established by the 38.2 Fib of the 91.17-84.84 of the JPY rally, thus breaking below the channel's lower boundary. Indicators remain in favor of the Swiss Franc longs with both momentum indicator and positive MACD above the zero line while overbought Stochastic gives the Japanese yen longs a chance to retaliate.
Key Levels & Technical Indicators

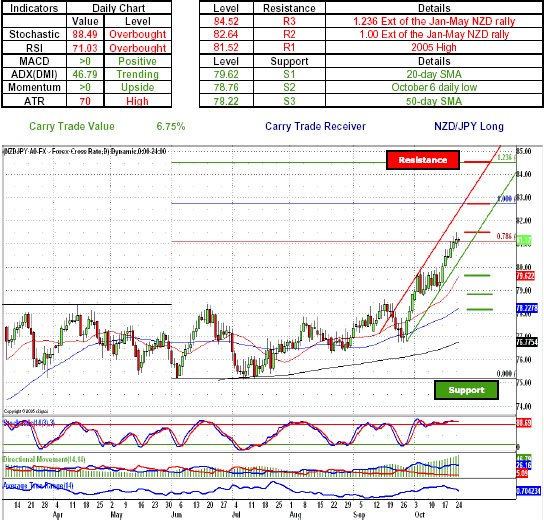
NZD/JPY - New Zealand dollar bulls continued their unrelenting assault as they further pushed the Japanese yen bulls above the psychologically important 80.00 handle. As Japanese yen bulls try to reestablish their dominance over the price action and push the cross lower, the next move to the downside will most likely see the NZDJPY test the New Zealand dollar defenses around 79.62, a level marked by the 20-day SMA. A further move to the downside most likely seeing the yen longs push the cross toward 78.76, an October 6 daily low and with sustained momentum taking on the New Zealand dollar defenses around 78.22, a level marked by the 50-day SMA. Indicators signal maturing trend with ADX above the key 25 mark at 46.79, not a direction of one, while both momentum and MACD remain above the zero line. Stochastic is signaling divergence thus adding to the outlook that the NZDJPY is beginning to top out.
Key Levels & Technical Indicators

Chart of the Moment

Sam Shenker is a Technical Currency Analyst for FXCM.