Technical Overview
- Euro Heads Back Below 1.2000
- Swiss Franc Retreats Toward 1.3000
- New Zealand Dollar Tests Offers Above .7000
Trader's Outlook
The price action is beginning to resemble a shoving match as majors continue to trade within a narrow range. As the market continues to get its bearings, this trader remains on sidelines as there are no definite clues to the direction of the short-term price action as it's extremely "noisy" and I believe there is no real money in trading "noise", just excessive volatility and an increased chance of having your stop-loss order hit, as market widely fluctuates with overall price levels remaining static
1-Day Currency Pair Outlook
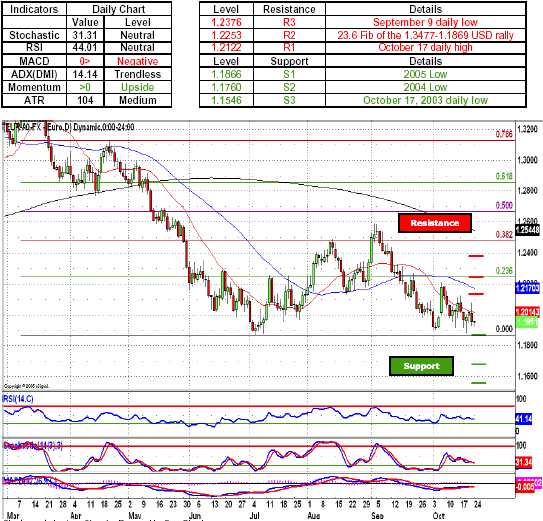
EUR/USD - Euro bulls once again found themselves on the other side of the counterattack launched by the greenback longs as the pair headed back down toward the psychologically important 1.2000 handle. In case euro longs manage to push back the advancing dollar longs a move to the upside will most likely see the euro longs test the dollar defenses above the 1.2000 handle at 1.2013, a level marked by the October 17 daily high. A sustained momentum will most likely see the pair head higher and take on the greenback defenses around 1.2100 handle, with a further move to the upside encountering a 50-day SMA at 1.2180. Indicators are diverging with momentum indicator above the zero line, while the negative MACD is sloping upward toward the zero line, while neutral oscillators give either side enough room to maneuver.
Key Levels & Technical Indicators
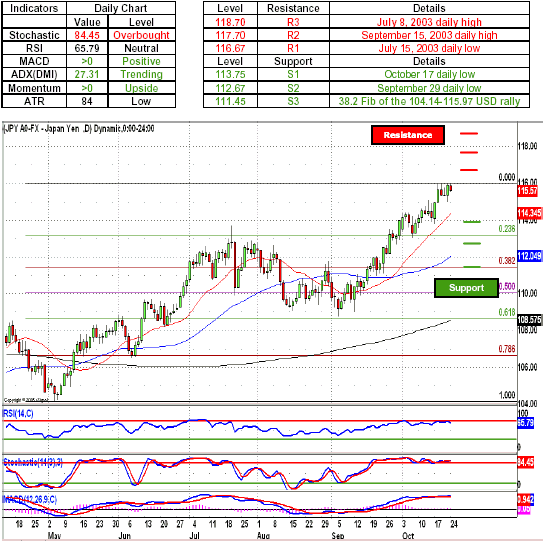
USD/JPY - Japanese Yen longs kept the pair virtually unchanged as the price action remained confined to a narrow 115.00-116.00 trading range. A break below the psychologically important 115.00 handle will most likely see the pair head lower and test the greenback defenses around 114.35, a level established by the 20-day SMA. A further move to the downside will most likely see the pair head toward the 113.20, a level marked by the 23.6 Fib of the 104.17-115.99 USD rally. Indicators remain supportive of the dollar longs with both momentum indicator and MACD treading above the zero line, with ADX above 25 at 27.31 signaling an existence of a trend not a direction of one, while overbought Stochastic gives the yen longs a chance to retaliate.
Key Levels & Technical Indicators
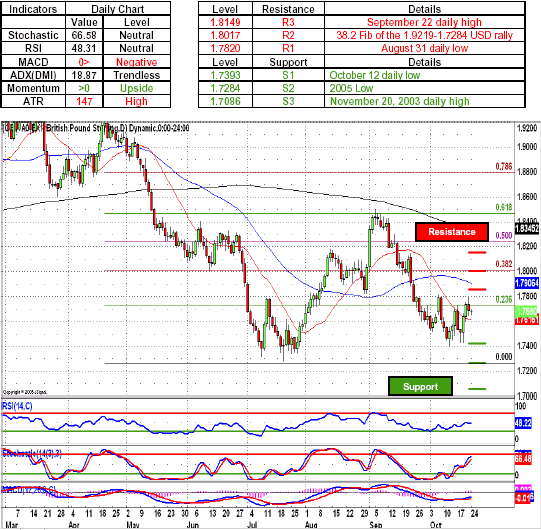
GBP/USD - British pound bulls fell back below the 1.7700 handle after their advance failed to push the greenback toward the 1.7820, a level marked by the August 31 daily high. Retaliation on the part of the sterling longs and a move above 1.7725, a level marked by the 23.6 Fib of the 1.9219-1.7284 USD rally will most likely see the pair head higher and aim for the psychologically important 1.8000 handle and take on the dollar defenses around 1.8017, a 38.2 Fib of the 1.9219-1.7284 USD rally. Indicators are diverging with momentum indicator above the zero line, while the negative MACD is sloping upward toward the zero line, while neutral oscillators give either side enough room to maneuver.
Key Levels & Technical Indicators
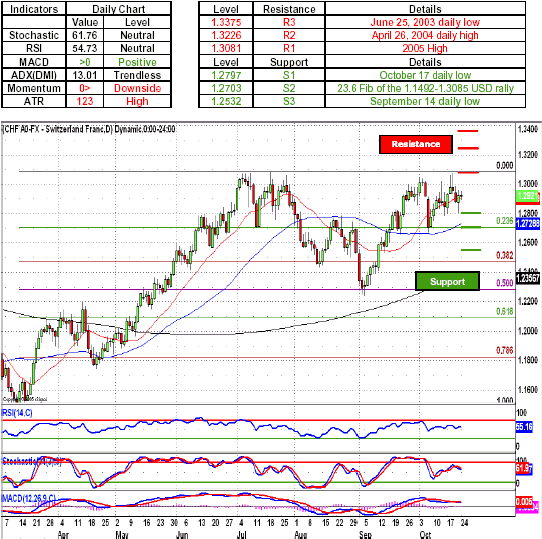
USD/CHF - Swiss Franc longs once again failed to gain sufficient momentum to break through the greenback defenses and retreated toward the psychologically important 1.3000 handle. As the price remained confined to a tight consolidation range a move tot the downside will most likely see the pair head toward the greenback defenses around 1.2797, a level established by the October 17 daily low. A sustained momentum on the part of the Swissie longs most likely seeing the pair take on the greenback bids around 1.2703, a level established by the 23.6 Fib of the 1.1492-1.3085 USD rally. Indicators are diverging with momentum indicator below the zero line, while the positive MACD is sloping downward toward the zero line, while neutral oscillators give either side enough room to maneuver.
Key Levels & Technical Indicators
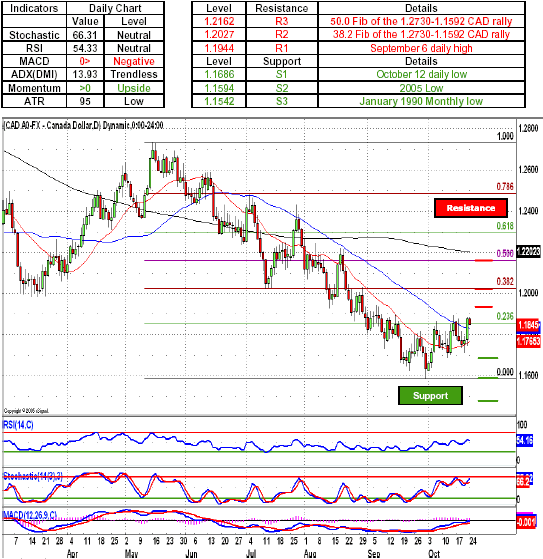
USD/CAD - Canadian dollar bulls continued to keep the pair confined to a 1.1857, a level marked by the 23.6 Fib of the 1.2730-1.1592 CAD rally, thus breaking above the 50-day SMA at 1.832. A further the upside will most likely see the greenback bulls take on the Loonie defenses around 1.944, a level established by the September 6 daily high, with sustained momentum seeing the pair head above the psychologically important 1.2000 handle and take on the 1.2028, a 38.2 Fib of the 1.2730-1.1592 CAD rally. Indicators are diverging with momentum indicator above the zero line while negative MACD is sloping upward toward the zero line; with neutral oscillators giving either side enough room to maneuver.
Key Levels & Technical Indicators
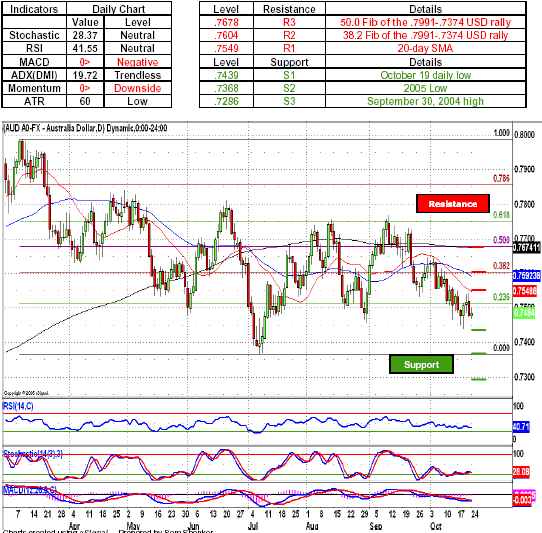
AUD/USD - Australian dollar bulls failed to keep the greenback longs above the psychologically important .7500 handle and collapsed through the .7513, a level marked by the 23.6 Fib of the.7991-.7374 USD rally. In case the Aussie longs try to push the greenback beck above the .7500 handle, a sustained momentum on the part of the Australian dollar longs will most likely see the pair take on the US dollar defenses around .7555, a level marked by the 20-day SMA. A further move to the upside will most likely see the pair head higher and test the greenback defenses around .7604, a 38.2 Fib of the .7991-.7374 USD rally. Indicators are favoring the US dollar bulls with both momentum indicator and MACD below the zero line, while neutral oscillator give either side enough room to maneuver.
Key Levels & Technical Indicators
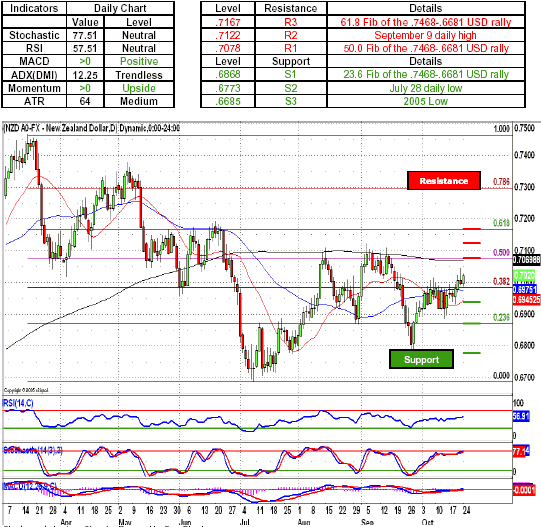
NZD/USD - New Zealand dollar bulls continued to keep the pair above the psychologically important .7000 handle in an attempt to reestablish their dominance over the price action. As New Zealand dollar longs manage to push tier way above the .7000 figure, a further move to the upside will most likely see Kiwi bulls lose their footing as the pair will most likely bounce off the .7075, a US dollar defensive position established by the 50.0 Fib of the .7498-.6681 USD rally. A reversal will most likely see the pair tumble below the .7000 figure and head toward the Kiwi's defenses around .6868, a 23.6 Fib of the .7498-.6681 USD rally Indicators are supportive of the New Zealand dollar longs with both momentum indicator and MACD treading above the zero line, while neutral oscillator give either side enough room to maneuver.
Key Levels & Technical Indicators
Sam Shenker is a Technical Currency Analyst for FXCM.


 Free Festival of Traders Videos