- GBP/JPY
- GBP/CHF
- GBP/AUD
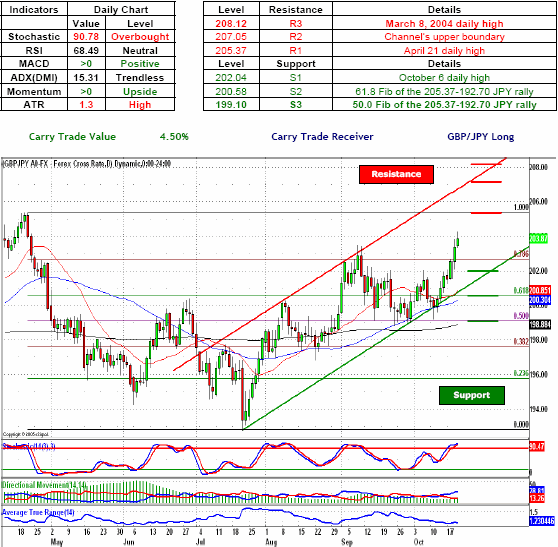
GBP/JPY - Cable bulls continued to pound the Japanese yen defenses after the sterling longs broke above the 202.66, a level marked by the 78.6 Fib of the 205.37-192.70 JPY rally, and took the cross above the 203.00 handle. A further move to the upside will most likely see the pound bulls push their way above the psychologically important 205.00 handle and punch through the Japanese yen defenses around 205.37, a level marked by the April 21 daily high. A sustained momentum on the part of the sterling longs will most likely see the cross head toward the 207.05, a level established by the channel's upper boundary. Indicators are favoring pound bulls with both momentum indicator and MACD above the zero line, while overbought Stochastic gives the yen longs a chance to retaliate.
Key Levels & Technical Indicators

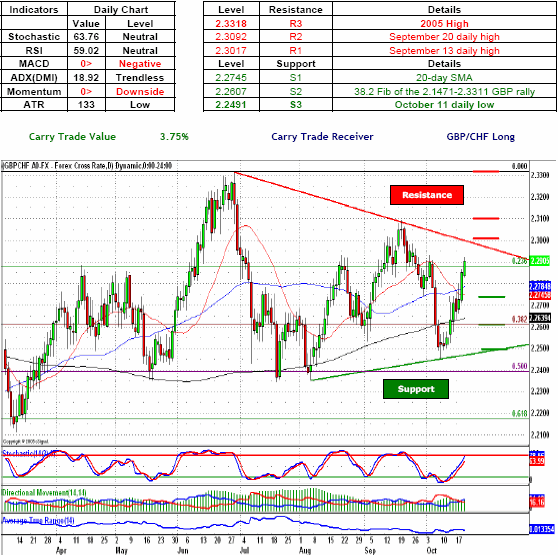
GBP/CHF - Swiss Franc bulls continued to retreat as the sterling bulls crushed every defensive position established by the Swissie bulls as the cross headed toward the 2.2900 handle, a level defended by the 23.6 Fib of the 2.2607, a 38.2 Fib of the 2.1471-2.3311 GBP rally. A move above will most likely see the pound longs encounter the triangle's upper boundary and with subsequent reversal seeing the cross head toward the sterling defenses around 2.2745, a level established by the 20-day SMA. Indicators are favoring Swiss Franc bulls with both momentum indicator and MACD below the zero line. Oscillators remain neutral, thus giving either side enough room to maneuver.
Key Levels & Technical Indicators

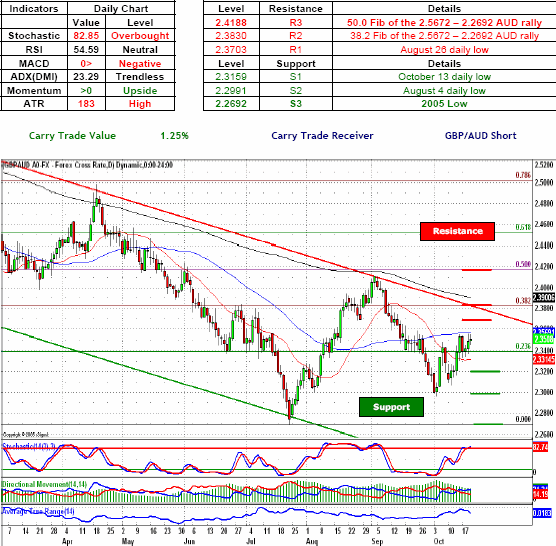
GBP/AUD - Australian dollar bulls continued to retreat as the sterling longs continued to press with their attack as cross edged closer to the psychologically important 2.3500 handle. As cable longs continue to push the cross higher, a break above the 2.3500 will most likely see the pound longs target the next level of Aussie defenses around 2.3703, a level marked by the August 26 daily low. A further collapse of the Australian dollar defenses will most likely see the cross target 2.3830, a level marked by the 38.2 Fib of the 2.5872-2.2692 AUD rally, and with sustained momentum to the upside breaking above the large channel's upper boundary which is further reinforced by the Aussie defenses around 2.3900, a 200-day SMA. Indicators are diverging with momentum indicator above the zero line while negative MACD is loping upward toward the zero line, while overbought Stochastic gives the Aussie longs a chance to retaliate.
Key Levels & Technical Indicators

Chart of the Moment

Sam Shenker is a Technical Currency Analyst for FXCM.