Technical Overview
- Euro Defends 2005 Low
- British Pound Defends 1.7400
- Canadian Dollar Continues To Range Trade
Trader's Outlook
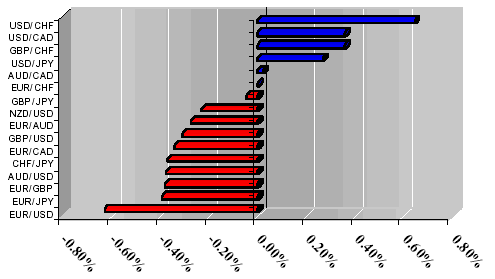
Dollar is up to its old tricks again, trying to break the major's defenses without managing to gain enough momentum, thus seeing the dollar advance fade into nothingness. A reversal will most likely to see a retrace that will become a precursor for the next major move for the dollar longs
1-Day Currency Pair Outlook
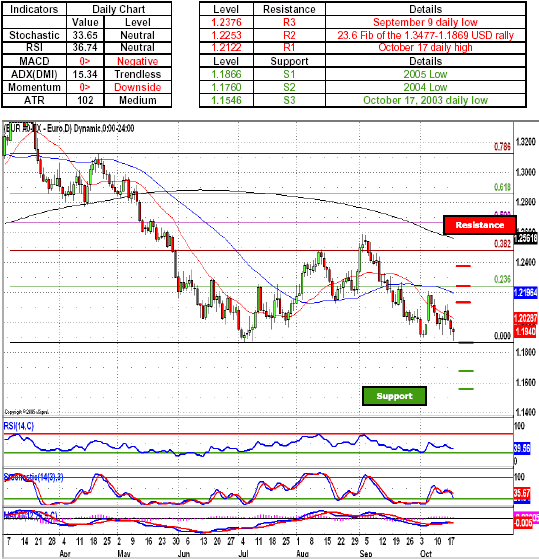
EUR/USD - Euro bulls had their horns ripped of by the dollar longs as the single currency longs found themselves once again starring at the 1.1866, a level marked by the 2005 Low. As the pair remains at critical levels a further break below will most likely see the euro bulls retreat toward 1.1760, a level marked by the 2004 low. However a reversal from these levels will most likely see the pair head back toward the psychologically important 1.2000 handle, which will most likely occur if the pair holds the current levels, but traders should expect the potential breakout to most likely turn into a fakeout as dealers take a stop fishing trip below the 1.1866 Indicators remain supportive of the dollar longs with both momentum indicator and MACD treading below the zero line, while neutral oscillators give either side enough room to maneuver.
Key Levels & Technical Indicators
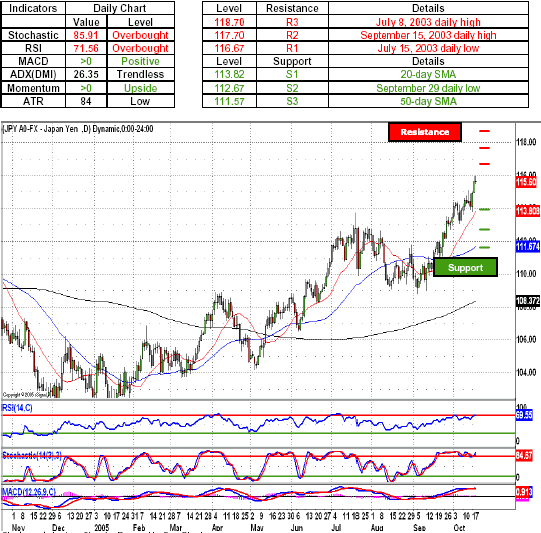
USD/JPY - Japanese Yen longs were on the wrong side of the market as more traders tried to catch the top on the move only to be swept aside by the stampeding dollar bulls as the pair approached the 116.00 handle. A sustained momentum to the upside will most likely see the pair head higher and test the yen defenses around 116.67, a level marked by the July 15, 2003 daily low, with a further move to the upside will most likely see the dollar longs push the yen bulls toward the 117.70, a September 15, 2003 daily low. Indicators remain supportive of the dollar longs with both momentum indicator and MACD treading above the zero line, while overbought Stochastic gives the yen longs a chance to retaliate.
Key Levels & Technical Indicators
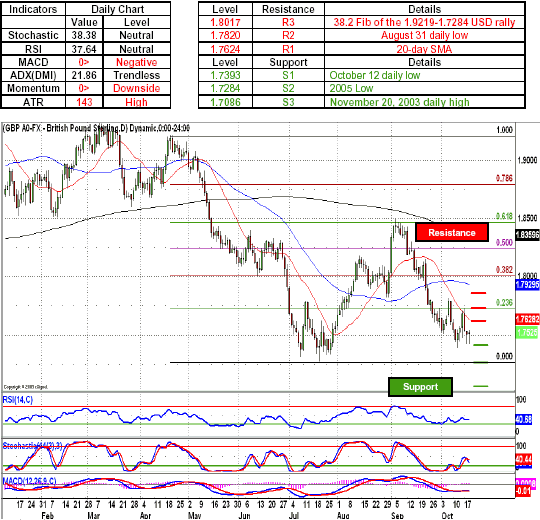
GBP/USD - British pound bulls once again felt the brunt of the latest attack by the dollar longs as the struggle for dominance edged closer to the 1.7393, a level marked by the October 12 daily low. As the price action remains below the psychologically important 1.7500 handle a break below the 1.7393 will most likely open the 1.7284, a 2005 low as a target, a level that acts as a gateway toward the psychologically important 1.7000 handle. However in case the sterling longs manage to push the pair back above the 1.7500 level, the next move to the upside will most likely see the pair head toward 1.7624, a 20-day SMA. Indicators remain supportive of the dollar longs with both momentum indicator and MACD treading below the zero line, while neutral oscillators give either side enough room to maneuver.
Key Levels & Technical Indicators
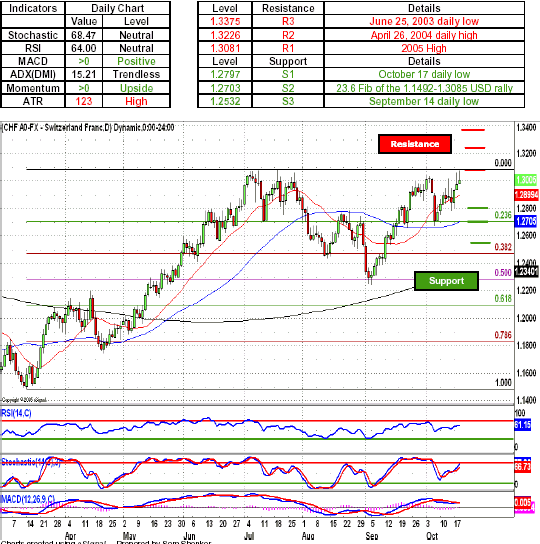
USD/CHF - Swiss Franc longs found themselves pushed against the 1.3081, a level marked by the 2005 high as greenback longs went on a full out assault. A reversal form this point will most likely see the Swiss Franc longs push the pair toward the 1.2901, a level marked by 20-day SMA. A further move to the downside will most likely see the Swissie take on the greenback defenses around 1.2797, a level established by the October 17 daily low. Indicators remain supportive of the dollar longs with both momentum indicator and MACD treading above the zero line, while neutral oscillators give either side enough room to maneuver.
Key Levels & Technical Indicators
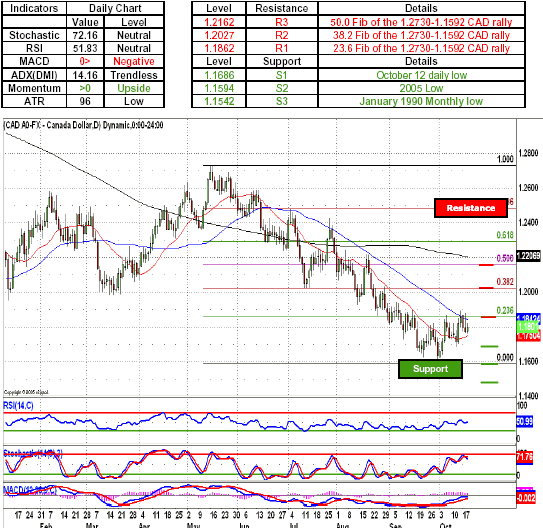
USD/CAD - Canadian dollar bulls managed to push the greenback longs away from the 1.1862, a level marked by the 23.6 Fib of the 1.2730-1.1592 CAD rally, which is further reinforced by the 50-day SMA at 1.1845. However an inability by the Loonie longs to push below the 1.1800 will most likely see the next move to the upside see the pair heading above the psychologically important 1.2000 handle and with sustained momentum the upside taking on the Loonie defenses around 1.2028, a 38.2 Fib of the 1.2730-1.1592 CAD rally. A further collapse of the Canadian dollar defenses will most likely see the pair test the offers around 1.2159, a level established by the 50.0 Fib of the 1.2730-1.1592 CAD rally. Indicators are diverging with momentum indicator above the zero line while negative MACD is sloping upward toward the zero line; with neutral oscillators giving either side enough room to maneuver.
Key Levels & Technical Indicators
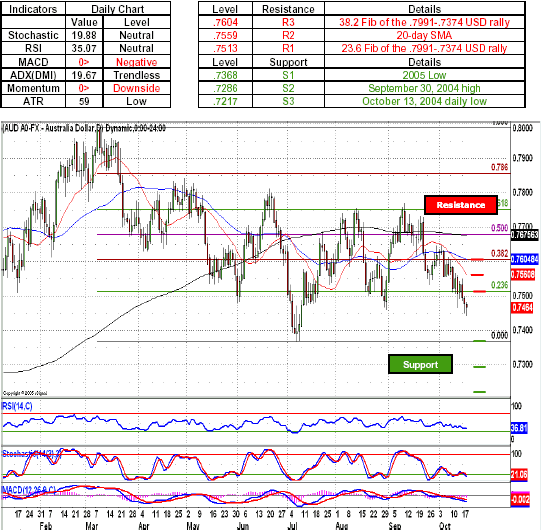
AUD/USD - Australian dollar bulls failed to keep push back the greenback longs as the pair tumbled below the psychologically important .7500 handle and came upon.7457, an Aussie defensive position established by the August 31 daily low, with a further move to the downside most likely seeing the greenback longs push their way toward .7368, a level marked by the 2005 Low. However a reversal for these levels will most likely see the pair head above the .7500 and take on the US dollar defenses around.7555, a level marked by the October 5 daily low. Indicators are favoring the US dollar bulls with both momentum indicator and MACD below the zero line while neutral oscillator give either side enough room to maneuver.
Key Levels & Technical Indicators
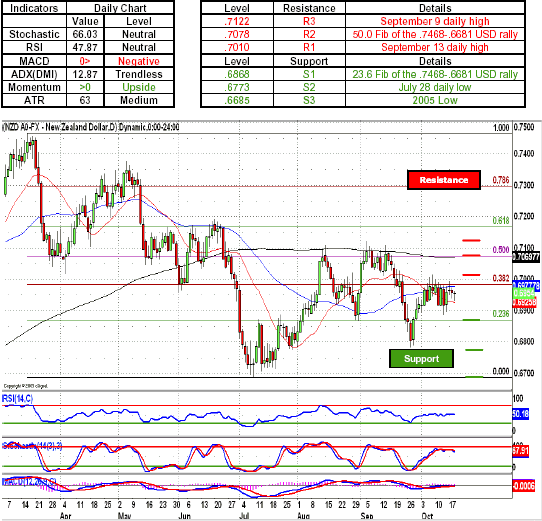
NZD/USD - New Zealand dollar bulls continued to tread water as the pair remained in an extremely tight trading range after the Kiwi longs repeatedly failed to break the greenback defenses around .6883, a level marked by the 38.2 Fib of the .7468-.6681 USD rally. As the price action switches sides in favor of the US dollar longs, a move to the downside will most like see the greenback test the New Zealand dollar defenses at .6868, a level marked by the 23.6 Fib of the .7468-.6681 USD rally. A further collapse of the Kiwi's defenses will most likely see the pair head toward the .6773, a New Zealand dollar defensive position established by the July 28 daily low. A further breakdown of the Kiwi's defenses most likely seeing the pair test the 2005 low at .6685. Indicators are diverging with momentum indicator above the zero line while negative MACD is sloping upward toward the zero line, while neutral oscillators give either side enough room to maneuver.
Key Levels & Technical Indicators
Daily Chart Analysis
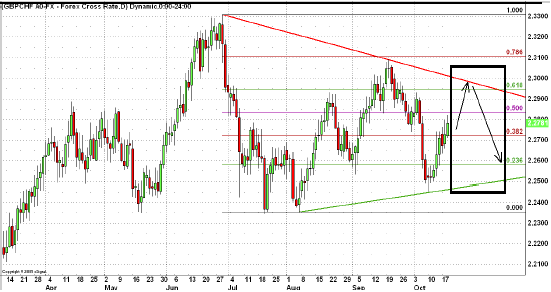
GBP/CHF remains confined to a large triangle that dominated the price action since July, with a move to the downside bouncing the psychologically important 2.2500 handle. A current move to the upside will most likely see the cross head toward the triangle's upper boundary and with subsequent reversal seeing the GBPCHF tumble toward the 23.6 Fib.
Sam Shenker is a Technical Currency Analyst for FXCM.