Technical Overview
- Japanese Yen Tests Offers Above 115.00
- Swiss Franc Aims for 1.3000
- New Zealand Dollar Consolidates In Tight Range
Trader's Outlook
Dollar continues to trade sideways as volatility in the market remains high with Japanese yen testing the offers above the 115.00, marking a new 2005 high, a level the dollar bulls not seen since 2003. This trader is still trying to get the bearing on the longer-term price action and as such is staying out of the market until a clear cut move is underway. There is no sense of chasing the price, let the price come to you.
1-Day Currency Pair Outlook

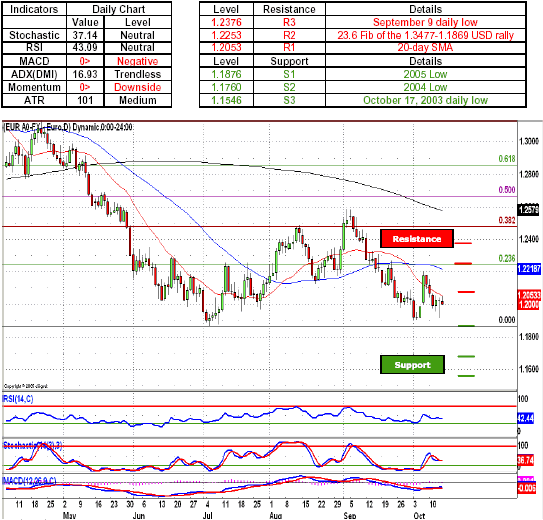
EUR/USD - Euro bulls went through another session of extreme volatility as the price action went nowhere fast with the pair testing the ids and offers on both sides of the psychologically important 1.2000 handle. As greenback longs psuh their way deeper into the euro held territory, a collapse of the single currency defenses around the 1.1900 handle, will most likely see the dollar longs make their way toward the 1.1876, a critical level marked by the 2005 low, with further breakdown targeting the 1.1760, a 2004 low. A collapse of the combination of the 2004-2005 lows will most likely see the pair head toward 1.1546, a level marked by the October 17, 2003 daily low, which currently acts as a gateway toward the psychologically important 1.1500 figure. Indicators are favoring the dollar bulls with both momentum indicator and MACD below the zero line, while neutral oscillators give wither side enough room to maneuver.
Key Levels & Technical Indicators
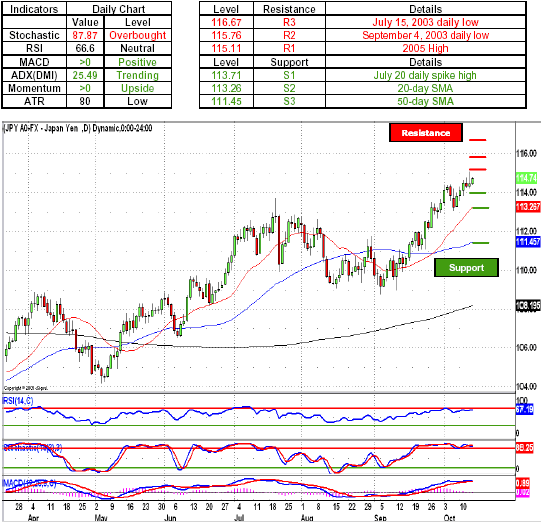
USD/JPY - Japanese Yen longs found themselves testing the offers above the psychologically important 115.00 handle as the pair visited the price levels not seen in over two years. A further break of the yen defenses will most likely see the head toward the 115.76, a level marked by the September 4, 2003, thus negating the advance made by the Japanese yen longs for the past two years, with sustained momentum by the greenback longs most likely seeing the Japanese yen retreat toward the 116.67, a July 15, 2003 daily low. Indicators remain supportive of the dollar longs with both momentum indicator and MACD treading above the zero line, ADX went above the 25 thus signaling trending conditions, with an overbought Stochastic adding to the trending outlook as most prolonged moves happened after the oscillators became overbought.
Key Levels & Technical Indicators
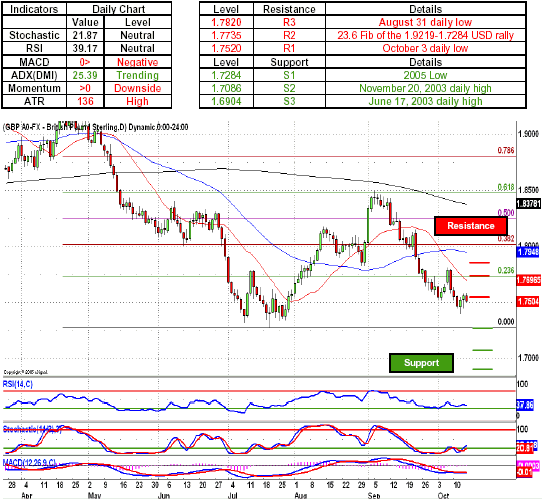
GBP/USD - British pound bulls managed to retaliate against the greenback longs with the price action stalling around 1.7500 handle, however an inability by the cable longs to gain momentum above the 1.7500 will most likely see the pair collapse toward 1.7284, a level marked by the 2005 low. A further break in the sterling defenses will most likely see the greenback longs push the pair toward the psychologically important 1.7000 handle, which is currently defended by the 1.7086, a November 20, 2003 daily high. A further collapse of the pound defenses will most likely see the greenback bulls push the pair below the 1.7000 figure and take on the sterling's bids around 1.6904, a defensive position established by the June 17, 2003 daily high, thus seeing the dollar reverse the advance made by the pound longs during the past two years. Indicators favor the dollar bulls with momentum indicator and MACD below the zero line, ADX went above the 25 thus signaling trending conditions, with an overbought Stochastic adding to the trending outlook as most prolonged moves happened after the oscillators became overbought.
Key Levels & Technical Indicators
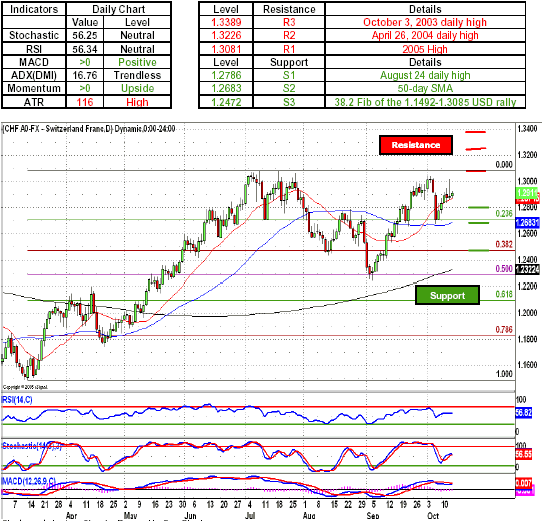
USD/CHF - Swiss Franc longs fought back against the advancing dollar longs as the pair once again was pressed against the psychologically important 1.3000 handle.. A move to the upside will most likely see the pair head higher and with sustained momentum will most likely seeing the greenback take on the 1.3081, a Swiss Franc defensive position established by the 2005 High, with a further move by the dollar longs will most likely see the pair head toward the 1.3226, an April 26, 2004 daily high. A further dollar advance will most likely see the pair retreat toward the highs not seen in two years as the greenback will most likely take on the Swiss Franc defenses around 1.3389, a level marked by the October 3, 2003 daily high. Indicators favor the dollar bulls with momentum indicator and MACD above the zero line, with neutral oscillators giving either side enough room to maneuver.
Key Levels & Technical Indicators
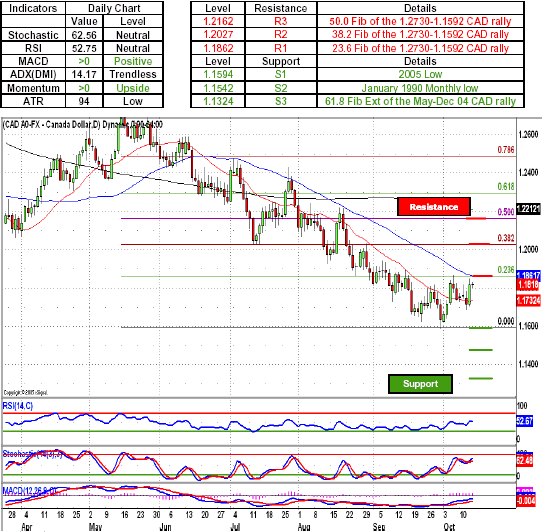
USD/CAD - Canadian dollar bulls found themselves on the bid side of the market as the pair headed toward the 1.1862 a level marked by the 23.6 Fib of the 1.2730-1.1592 CAD rally, which is further reinforced by the 50-day SMA. A next move to the upside most likely seeing the pair heading above the psychologically important 1.2000 handle and with sustained momentum the upside taking on the Loonie defenses around 1.2028, a 38.2 Fib of the 1.2730-1.1592 CAD rally. Indicators are diverging with momentum indicator above the zero line while negative MACD is sloping upward toward the zero line; with neutral oscillators giving either side enough room to maneuver.
Key Levels & Technical Indicators
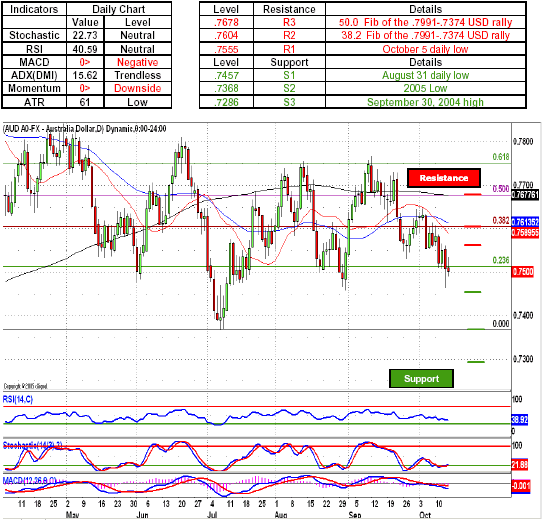
AUD/USD - Australian dollar defenses collapsed under the onslaught by the greenback bulls with the pair tumbling below the psychologically important .7500 handle. A further collapse of the Aussies defenses will most likely see the US dollar longs make their way toward the .7457, an Aussie defensive position established by the August 31 daily low, with a further move to the downside most likely seeing the greenback longs push their way toward .7368, a level marked by the 2005 Low. A further collapse of the Aussie defenses will most likely see the pair head toward the .7286, a level marked by the September 30, 2004. Indicators are favoring the US dollar bulls with both momentum indicator and MACD below the zero line while neutral oscillator give either side enough room to maneuver.
Key Levels & Technical Indicators
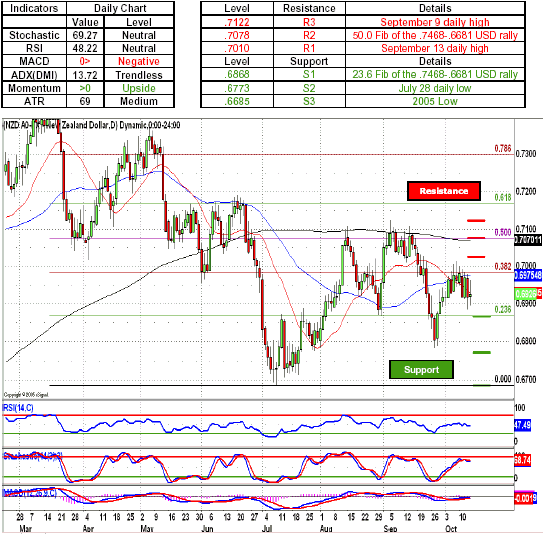
NZD/USD - New Zealand dollar bulls remained in a limbo as the pair revolved the .6900 handle, but managed to land on their feet and once again opposed the greenback longs. As the price action remains on the side of the dollar longs, a further move to the downside will most like see the greenback test the New Zealand dollar defenses at .6868, a level marked by the 23.6 Fib of the .7468-.6681 USD rally. A further collapse of the Kiwi's defenses will most likely see the pair head toward the .6773, a New Zealand dollar defensive position established by the July 28 daily low. A further breakdown of the Kiwi's defenses most likely seeing the pair test the 2005 low at .6685. Indicators are favoring the US dollar bulls with both momentum indicator and MACD below the zero line with neutral oscillators giving either side enough room to maneuver.
Key Levels & Technical Indicators
Sam Shenker is a Technical Currency Analyst for FXCM.