| Options Expiration Week Analysis |
| By Price Headley |
Published
04/15/2009
|
Options
|
Unrated
|
|
|
|
Options Expiration Week Analysis
Expiration week has become extra volatile over the past few years as traders scramble to position themselves in the ever changing markets. I did some extensive research last November on the effect of performance during expiration week, and how the returns during expiration week can affect the following week's performance.
Technical Analysis is based on the premise that you can use historical data to predict future market moves. Although you won't always be right, if you can gain an edge through studying past price action, you will be one step ahead of your competition. We spend hours pouring over charts and indicators, but I find it very helpful to spend some time with just prices and a trusty spreadsheet, trying to spot the patterns as well as the trends.
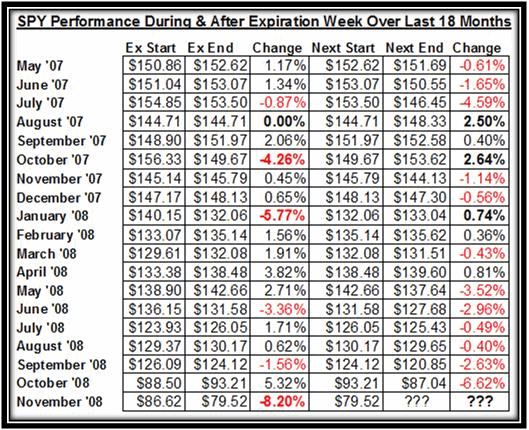
Below is the chart from last November.

This data suggests three main points:
1) Eleven of the last 18 times, the performance after expiration has been in the opposite direction of during expiration. Although this is slightly over half the time, it does show us that the market can get overextended one way or the other during expiration, and often needs to turn back in the other direction to correct itself.
This has held especially true nine of the last 13 times (69%) since November of 2007.
2) Volatility has gone through the roof recently. We all are familiar by now with the VIX-the CBOE Volatility Index. As we have been documenting for the past five to six weeks, the VIX has remained in "extreme" territory, allowing these 400+ point moves on the Dow that we have become accustomed to.
The chart also shows us how the volatility has picked up since September. Over the last 18 months, the average expiration week performance has been 0.42%, and the average next week's performance has been -1.01%. Taking a look at the numbers from the past two months, they have been extremely bullish or extremely bearish, with no middle ground.

And last week's 8.2% drop in the SPY showed that not only is this trend continuing, but it is accelerating.
3) This week's performance is likely to be convincingly bullish. Last month, we gained 5.32% on the SPY during expiration week, only to give it all back when we dropped 6.62% the following week.
November is poised to reverse that performance after dropping 8.2% last week. I am expecting a strong rally of 7-9% to gain back all of last week's losses. Some of the strongest next-week performances have been after strong selling, as shown in bold on the big chart above.
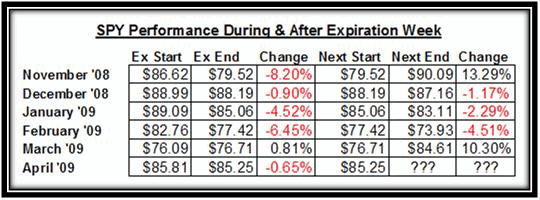
Here is what actually has happened since November.

November posted better than expected returns after expiration week with a 13% return. The run in November happened after the market reached new lows, which is very important. The market once again reached new lows in March, right before the strong rally that we are currently experiencing.
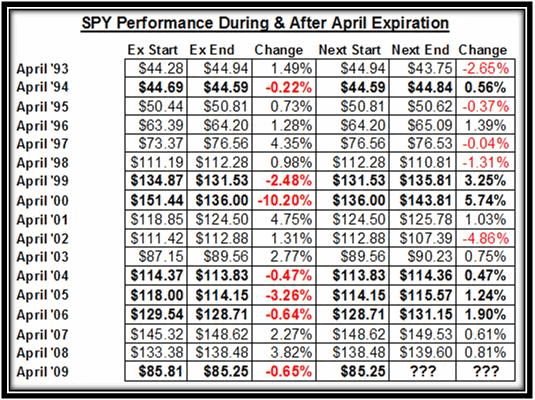
As for the current April expiration week, as well as next week, what should we expect? Well Friday should be bullish, considering that the Dow has been up 10 of the last 12 April Expiration days. Also, the SPY is down on the week thus far. The last 6 times that April expiration week was negative, the market rebounded the following week. The caveat here is that if we close this week with a marginal gain of 1.5% or less, then chances are good that next week will send us lower, as has been the case 4 of the last 5 times.

The action over the next 7 trading days should be bullish to flat, likely not closing up or down more than 1.5%. The intra-day moves could be large, but the net change will likely be relatively small. Earnings announcements for major companies will sway the market during that period, especially within the financial sector.
Price Headley is the founder and chief analyst of BigTrends.com.
|