Technical Overview
- Euro Back Below 1.2200
- Japanese Yen Fails To Gain Momentum
- Australian Dollar Fails To Break Above .7600
Market Outlook
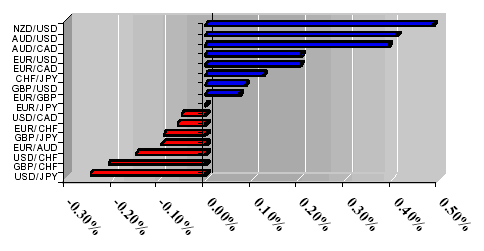
Dollar came out a champion on Friday as an event risk took a hold of the entire market and pushed most of the majors lower, however Canadian dollar is proving to be an exceptions as the price action in the other majors seems to have no effect on it. The best course right now is most likely to remain on the sidelines and observe the price action for a proper trading signal when it comes to USD/CAD.
1-Day Currency Pair Outlook
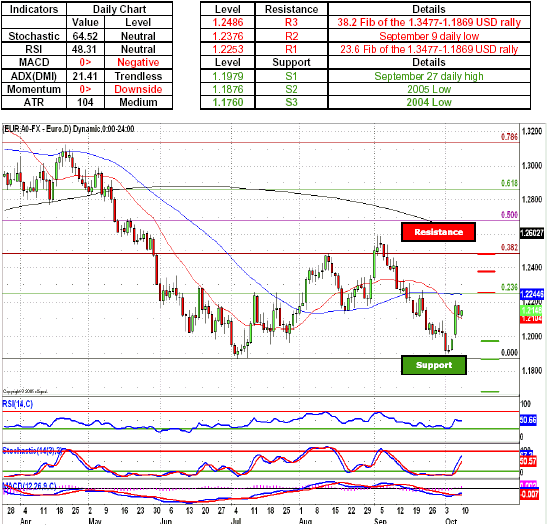
EUR/USD - Euro bulls were stopped in their tracks after managing to post significant gains during the preceding trading session. As the price action remains subdued a move above the 1.2200 figure will most likely see the single currency longs push their way toward the 1.2253, a level marked by the 23.6 Fib of the 1.3477-1.1869 USD rally, which is further reinforced by the 50-day SMA. A further break in the dollar's defenses seeing the euro bulls push their way toward the 1.2376, a level marked by the September 9 daily low. However a reversal from current levels will most likely see the dollar bulls push the single currency below the 1.2100 figure toward the psychologically important 1.2000 handle. Indicators are favoring the dollar bulls with both momentum indicator and MACD below the zero line, while neutral oscillators give wither side enough room to maneuver.
Key Levels & Technical Indicators
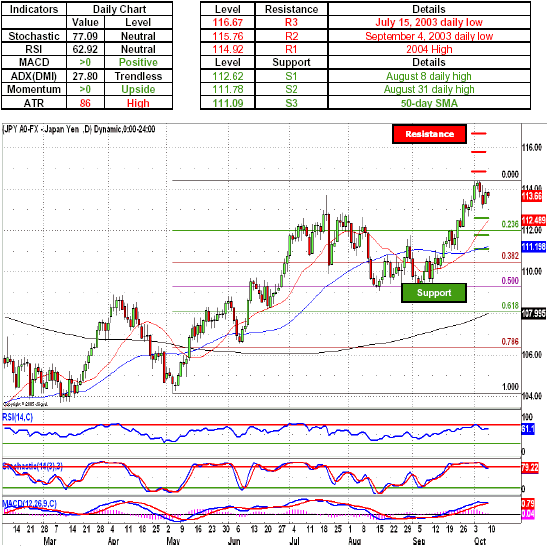
USD/JPY - Japanese Yen longs continued to consolidate within a tight trading range as the price action remained volatile, with neither side managing to any significant advances. A break to the downside will most likely see the pair head toward the 113.00 figure and test the dollar defenses around 112.62, a level marked by the August 8 daily high. A further break in the greenback defenses will most likely see the yen bulls extend the retrace toward 111.78, a dollar defensive position established by the August 31 daily high, with retrace will most likely running its course around the 111.50 mark. However a continuation of the dollar advance will most likely see the pair head above the 114.00 handle and see the greenback bulls take on the Japanese yen offers around 114.92, a level marked by the 2004 High. Indicators remain supportive of the dollar longs with both momentum indicator and MACD treading above the zero line, while neutral oscillators give either side room to expand.
Key Levels & Technical Indicators
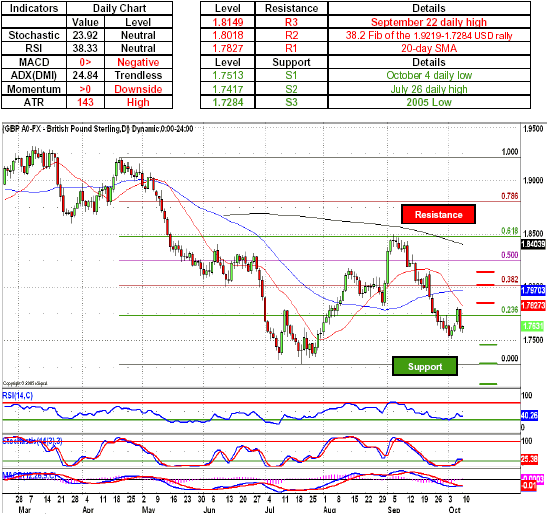
GBP/USD - British pound bulls were slaughtered by the dollar longs after the cable longs failed to make much headway above the 1.7800 handle. As the price action consolidates after a sharp retreat and enters a critical stage, a move to the upside will most likely see the sterling longs test their luck as they push the pair toward the 1.7700 figure in an attempt of testing the dollar defenses around 1.7734, a level marked by the 23.6 Fib of the 1.9219-1.7284 USD rally, a further move to the upside will most likely see the cable test the greenback defense around 1.7826, a 20-day SMA and a recent minor swing high. A sustained momentum on the part of the cable longs will most likely see the pair head straight for 1.7973, a 50-day SMA and a gateway to the psychologically important 1.8000 handle. Indicators favor the dollar bulls with momentum indicator and MACD below the zero line, with neutral oscillators give either side enough room to maneuver.
Key Levels & Technical Indicators
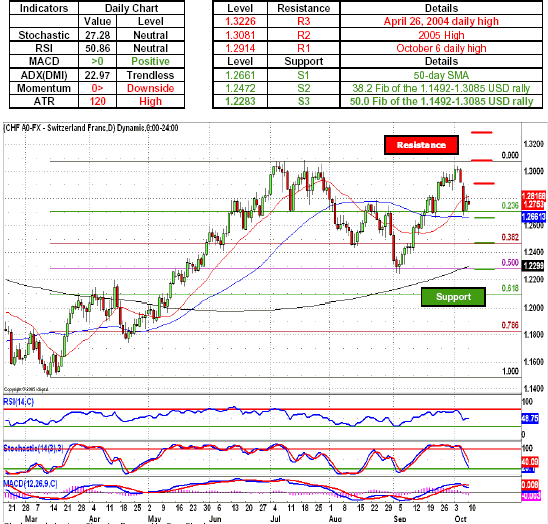
USD/CHF - Swiss Franc longs continued to engage the dollar bids after the initial charge by the Swissie bulls bounced of the 1.2700 handle, a level defended by the 23.6 Fib of the 1.1492-1.3085 USD rally. Another move to the downside will most likely see the Swiss Franc longs push their way toward the 1.2661, a 50-day SMA, with a break below most likely seeing the pair head toward the psychologically important 1.2472 figure, a level marked by the 38.2 Fib of the 1.1492-1.3085 USD rally. A subsequent reversal will most likely see the greenback longs spring into action and head toward the 1.2500 figure. Indicators began to diverge with momentum indicator dipping below the zero line while positive MACD is sloping down toward the zero line, with neutral oscillators giving either side enough room to maneuver.
Key Levels & Technical Indicators
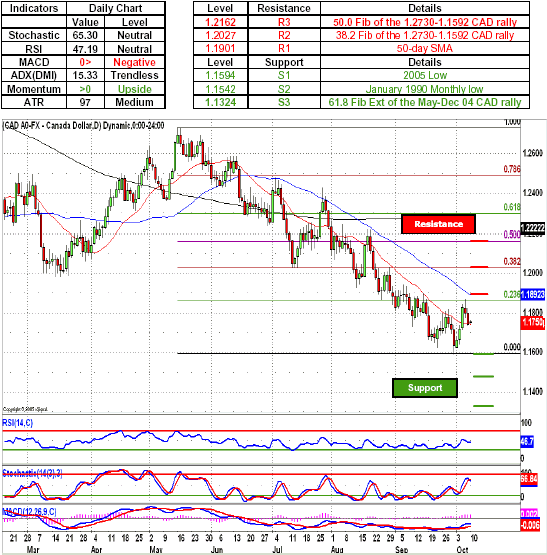
USD/CAD - Canadian dollar bulls managed to push the greenback longs below the 1.1800 handle and continued to consolidate their gains as the pair revolved around the 1.1750 level. If the US dollar bulls fail to recover and pullback toward their defensive positions, the next move by the Loonie will most likely see the pair head below the 1.1700 level and with further momentum take on the greenback bids around 1.1600 figure, a level marked by the 2005 low at 1.1594. In case the Loonie longs fail to launch a counterattack and retreat above the 1.1800 figure, the next move by the US dollar bulls will most likely see the pair head toward 1.1830, a level marked by the September 19 daily high. Indicators began to diverge with momentum indicator dipping below the zero line while positive MACD is sloping down toward the zero line, with neutral oscillators giving either side enough room to maneuver.
Key Levels & Technical Indicators
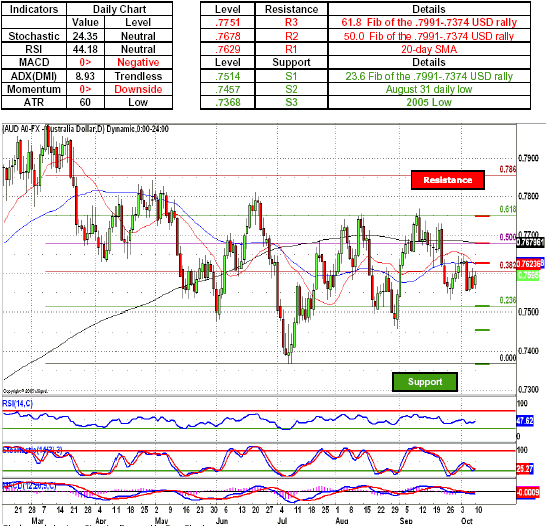
AUD/USD - Australian dollar longs once again failed to break the greenback defenses protecting the .7600 figure as Aussie longs lacked enough momentum to punch through the US dollar defenses. As greenback longs muster their forces and push the Australian bulls lower, a move toward the .7514, a level marked by the 23.6 Fib of the .7991-.7374 USD rally, will most likely see the pair gain momentum and most likely see the Australian dollar retreat toward the .7457, an Aussie defensive position established by the August 31 daily low, thus breaking below the psychologically important .7500 figure. A further move to the downside will most likely see the greenback longs push their way toward .7368, a level marked by the 2005 Low. Indicators are favoring the US dollar bulls with both momentum indicator and MACD below the zero line. Stochastic became oversold, thus giving the Aussie longs a chance for a pullback.
Key Levels & Technical Indicators
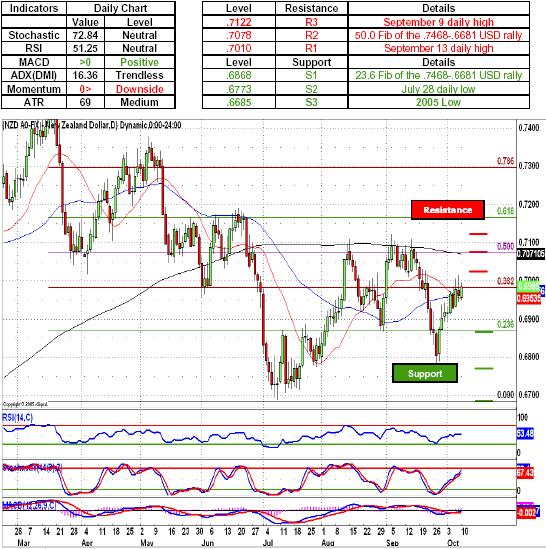
NZD/USD - New Zealand dollar bulls once again found themselves staring at the .7000 handle from below as greenback longs continued to pull their offers together ahead of the sharp move against the Kiwi positions. As NZD longs give up their territory, a move toward the .6900 figure will most like see the pair head below and test the New Zealand dollar defenses at .6868, a level marked by the 23.6 Fib of the .7468-.6681 USD rally. A further collapse of the Kiwi's defenses will most likely see the pair head toward the .6773, a New Zealand dollar defensive position established by the July 28 daily low. Indicators began to diverge with momentum indicator dipping below the zero line while positive MACD is sloping down toward the zero line; with neutral oscillators giving either side enough room to maneuver.
Key Levels & Technical Indicators
Sam Shenker is a Technical Currency Analyst for FXCM.