Technical Overview
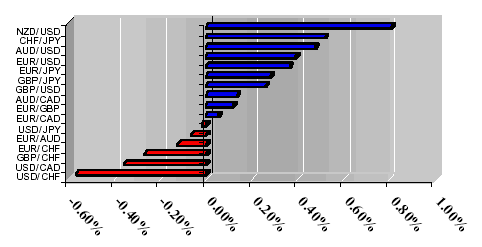
- Euro Retakes 1.2000
- British Pound Fails To Hold 1.7700
- New Zealand Dollar Once Again Challenges .7000
Market Outlook
Dollar continues to give back some of the recently captured territory, but if no one gives then there will be nothing to take back once the retrace runs its course. For the market to remain dynamic someone always has to be on the right side of the market and someone will have to be on the other side of it, market is always right, it's up to the individual trader to figure out what side he or she is on.
1-Day Currency Pair Outlook
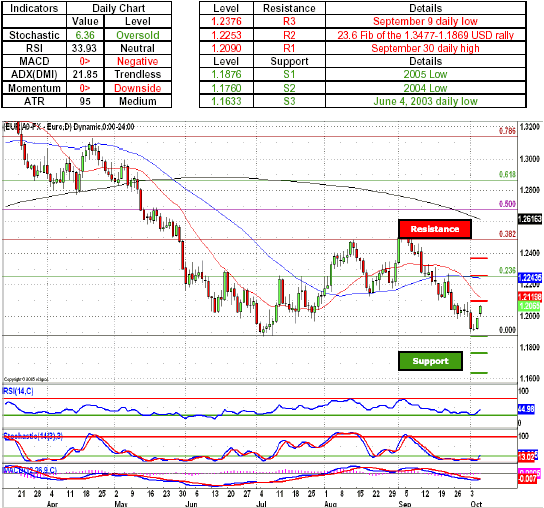
EUR/USD - Euro bulls continued to advance against the dollar positions as the single currency bulls managed to push the pair above the psychologically important 1.2000 figure. As retrace continues a move above the 1.2090, a level marked by the September 30 daily high, will most likely see euro bulls break the dollar defenses and test the greenback offers around 1.2119, a 20-day SMA, and with sustained momentum heading above the 1.2200 figure. A break above the 1.2200 will most likely see the retrace run its course as momentum will most likely stall around 1.2253, a level marked by the 23.6 Fib of the 1.3477-1.1869 USD rally. Indicators are favoring the dollar bulls with both momentum indicator and MACD below the zero line, while extremely oversold Stochastic gives the euro bulls a chance to retaliate.
Key Levels & Technical Indicators
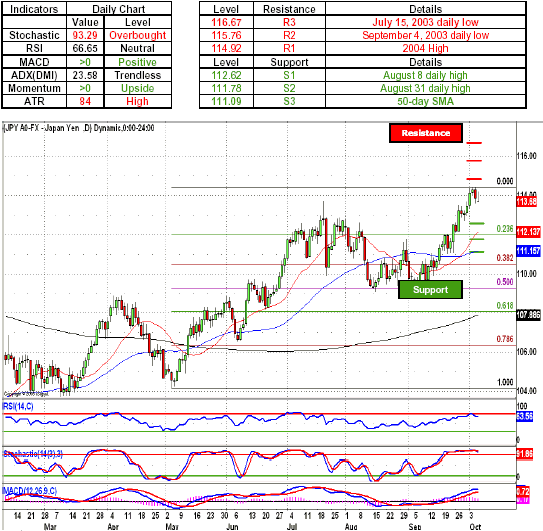
USD/JPY - Japanese Yen longs managed to stop the greenback counterattack and pushed the pair lower after a brief foray above the 114.00 handle. As the price action remains on the side of the Japanese yen bulls, a move to the downside will most likely see the pair head toward the 113.00 figure and with a break to the downside testing the dollar defenses around 112.62, a level marked by the August 8 daily high. A further break in the greenback defenses will most likely see the yen bulls extend the retrace toward 111.78, a dollar defensive position established by the August 31 daily high, with retrace will most likely running its course around the 111.50 mark. Indicators remain supportive of the dollar longs with both momentum indicator and MACD treading above the zero line, while overbought Stochastic gives the yen longs a chance to retrace part of the dollar rally.
Key Levels & Technical Indicators
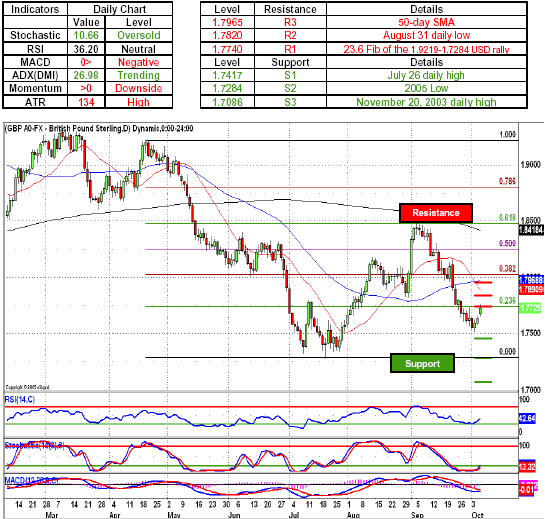
GBP/USD - British pound bulls got a little to far ahead of themselves and were instantly put back in place by the dollar bulls just as the pair was climbing above the 1.7700 figure and probing the greenback defenses around 1.7740, a level marked by the 23.6 Fib of the 1.9219-1.7284 USD rally. As cable longs regroup and continue the retrace, break above the 1.7740 will most likely see the pound bulls push their way toward the 1.7820, a level marked by the August 31 daily low and with sustained momentum heading straight for 1.7967, a 50-day SMA and a gateway to the psychologically important 1.8000 handle. Indicators favor the dollar bulls with ADX above 25 signaling trending conditions, while momentum indicator and MACD below the zero line, with oversold Stochastic adding to the out look that the price action continues to remain on the side of greenback longs.
Key Levels & Technical Indicators
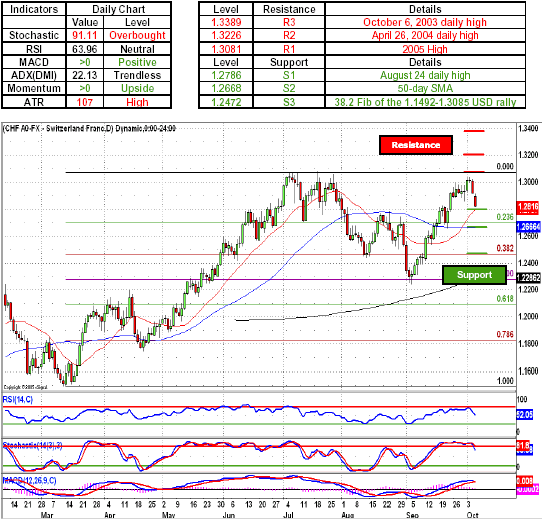
USD/CHF - Swiss Franc longs remained the most unrelenting anti-dollar on the battlefield as the pair headed toward the 1.2800 figure, as dollar defenses crumbled like they did not exist. A breakdown below the 1.2800 figure, will most likely see the Swissie bulls take on the dollar defenses at 1.2786, a level marked by the August 24 daily high. A further move to the downside will most likely see the Swissie longs push their way below the 1.2700 figure and take on the greenback defenses around 1.2668, a 50-day SMA, at which point the retrace will most likely run its course and the dollar dominated price action will return to the market. Indicators continue to favor dollar longs with both momentum indicator and MACD above the zero line. Stochastic remains extremely oversold thus giving the Swiss Franc longs a chance to retaliate.
Key Levels & Technical Indicators
USD/CAD - Canadian dollar bulls received a temporary relief from the attacking greenback bulls as the price action stalled around the 1.1800 handle. If the US dollar bulls fail to recover and pullback the next move by the Loonie will most likely see the pair head below the 1.1700 level and with further momentum take on the greenback bids around 1.1600 figure. In case the Loonie longs fail to launch a counterattack and retreat above the 1.1800 figure, the next move by the US dollar bulls will most likely see the pair head toward 1.1830, a level marked by the September 19 daily high. Indicators continue to favor Canadian dollar bulls with both MACD and momentum indicator below the zero line, while neutral oscillators give US dollar longs enough room to maneuver.
Key Levels & Technical Indicators

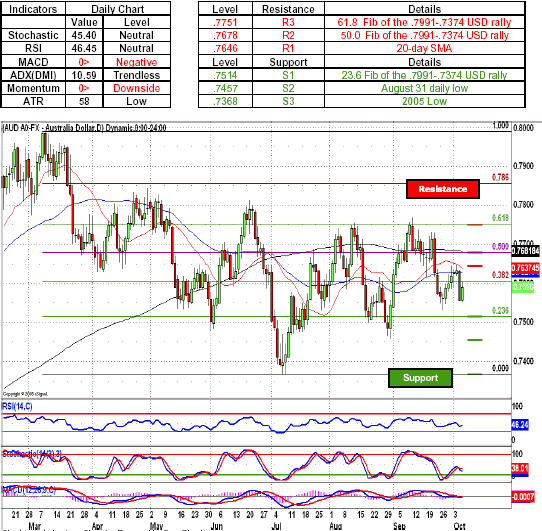
AUD/USD - Australian dollar longs retaliated against the US dollar bulls and once again pushed the pair toward the .7600 figure. As the price action continued to revolve around the .7600 handle, a move by the Aussie longs will most likely fail to hold the .7600 figure and collapse back down toward the .7514, a level marked by the 23.6 Fib of the .7991-.7374 USD rally, and with sustained momentum most likely seeing the Australian dollar retreat toward the .7457, an Aussie defensive position established by the August 31 daily low, thus breaking below the psychologically important .7500 figure. Indicators are favoring the US dollar bulls with both momentum indicator and MACD below the zero line. Stochastic became oversold, thus giving the Aussie longs a chance for a pullback.
Key Levels & Technical Indicators
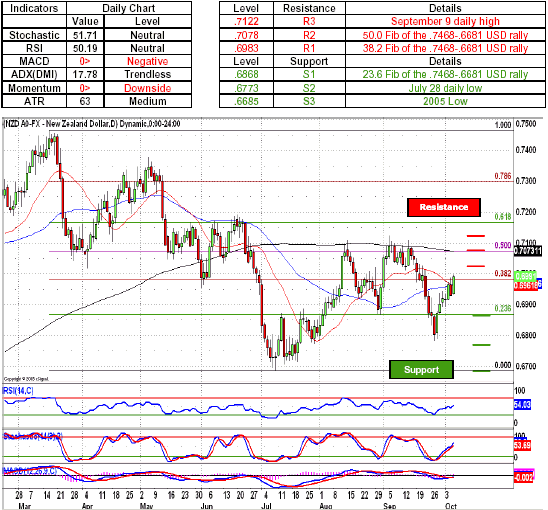
NZD/USD - New Zealand dollar bulls proved to extremely resourceful as they pushed the pair above the .7000 figure. As Kiwi remains on the side of other majors and pushes the pair higher, a break above the .7000 handle will most likely see the New Zealand dollar bulls take on the greenback defenses around .7010, a level marked by the September 13 daily high. A further break to the upside will most likely see the NZD longs test the US dollar offers around.7078, a level marked by the 50.0 Fib of the .7468-.6681 USD rally, which is further reinforced by the 200-day SMA. Indicators remain in favor the US dollar bulls with both momentum indicator and MACD below the zero line; with oversold Stochastic adding to the outlook that the prolonged movement to the downside is here to stay.
Key Levels & Technical Indicators
Sam Shenker is a Technical Currency Analyst for FXCM.