| Awaiting Oil's Test of Support |
| By Mike Paulenoff |
Published
03/11/2009
|
Futures , Stocks
|
Unrated
|
|
|
|
Awaiting Oil's Test of Support
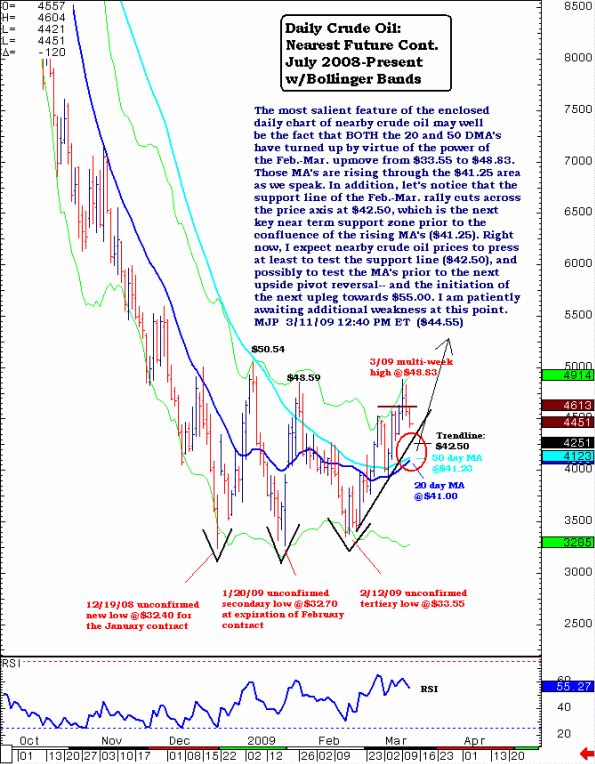
The most salient feature of the enclosed daily chart of nearby oil may well be the fact that both the 20- and 50-day moving averages have turned up by virtue of the power of the February-March upmove from $33.55 to $48.83. Those moving averages are rising through the $41.25 area as we speak. In addition, let's notice that the support line of the February-March rally cuts across the price axis at $42.50, which is the next key near-term support zone prior to the confluence of the rising moving averages ($41.25). Right now I expect nearby crude oil prices to press at least to test the support line ($42.50) and possibly to test the moving averages prior to the next upside pivot reversal -- and the initiation of the next upleg towards $55.00. We am patiently awaiting additional weakness at this point as we consider playing crude oil via its U.S. Oil Fund ETF (NYSE: USO).

Mike Paulenoff is a 26-year veteran of the financial markets and author of MPTrader.com, a real-time diary of his technical chart analysis and trading alerts on all major markets. For more of Mike Paulenoff, sign up for a free 15-Day trial to his MPTrader Diary by clicking here.
|