- AUD/CAD
- AUD/JPY
- AUD/NZD
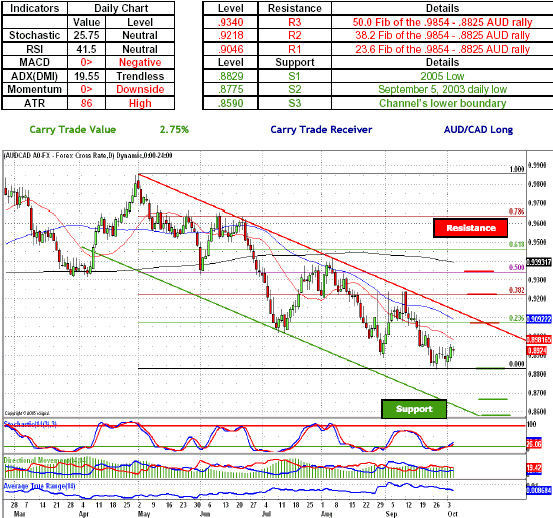
AUD/CAD - Canadian dollar longs continued to engage the Australian dollar counterparts in all out shoving match as the price action remained confined to a narrow trading range. As the cross remains confined to a large downward sloping channel and is currently less than a 100 pips away fro the 2005 low, which is exactly the same as 2004 low, a break below the .8830, a 2005 Low will most likely see the Loonie longs reestablish their dominance over the price action and push the Aussie longs toward the .8775, a level marked by the September 5, 2003 daily low. However, is the Australian dollar longs manage to push the cross above the .9000 handle, their next move to the upside will most likely see the Canadian dollar longs retreat above the .9046, a level marked by the 23.6 Fib of the .9854-.8825 AUD rally, thus breaking the channel's upper boundary. Indicators remain in favor of CAD longs with both MACD and momentum indicator below the zero line, while neutral oscillators give either side enough room to maneuver.
Key Levels & Technical Indicators

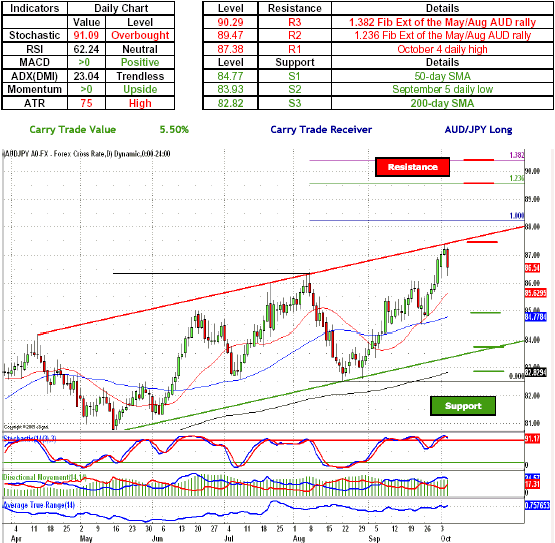
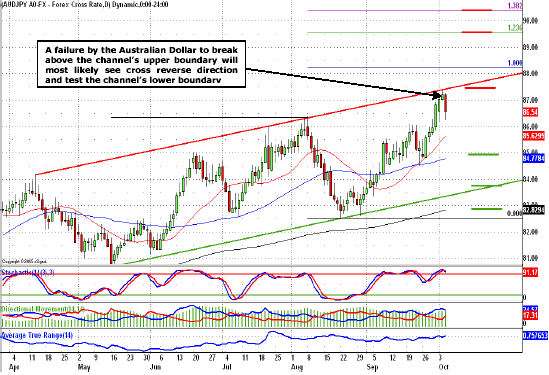
AUD/JPY - Japanese yen bulls managed to launch a decisive counterattack against the Australian dollar longs after the cross failed to break above the upward sloping channel's upper boundary. As the price action switches favorite sides, the next move by the Japanese yen longs will most likely see the pair establish an evening star reversal pattern and with subsequent move toward the channel's lower boundary taking on Aussie bids around 84.77, a level marked by the 50-day SMA. A further move below the psychologically important 85.00 handle will most likely see the cross test the Australian dollar defenses around 83.93, a September 5 daily low, which is further reinforced by the channel's lower boundary. Indicators continue to support Aussie longs with both momentum indicator and MACD above the zero line, while extremely overbought Stochastic gives the Japanese Yen longs a chance to retaliate.
Key Levels & Technical Indicators

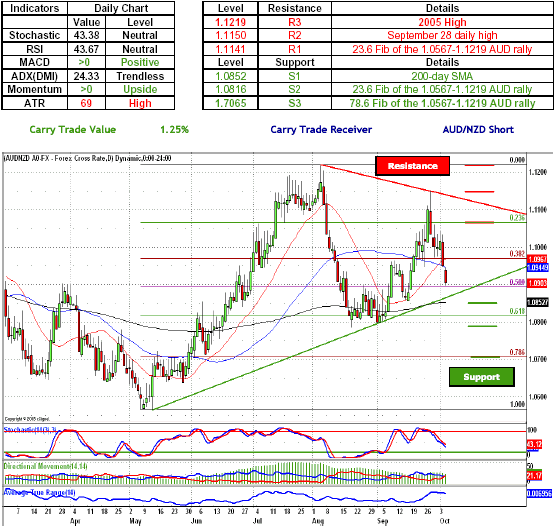
AUD/NZD - New Zealand dollar bulls continued to push its antipodean counterpart lower as the cross broke below the psychologically important 1.1000 handle. As the price action remain confined to a large triangle, a further move to the downside will most likely see the Kiwi longs test the triangle's lower boundary which is further reinforced by the 50.0 Fib of the 1.0567-1.1219 AUD rally. As the price action remains confined to a narrowing trading range, a break below the triangle's lower boundary will most likely see the cross test the Australian dollar defenses around 1.0853, a level marked by the 200-day SMA. Indicators remain in favor of the Australian dollar longs with both momentum indicator and MACD remaining above the zero line, while neutral oscillators give the either side enough room to maneuver.
Key Levels & Technical Indicators

Chart of the Moment

Sam Shenker is a Technical Currency Analyst for FXCM.