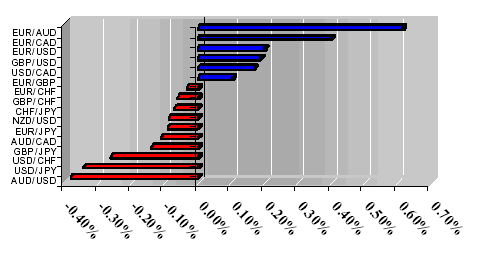
- British Pound Leads Retrace
- Japanese Yen Breaks Below 114.00
- Antipodeans Begin To Collapse
Market Outlook
Dollar is an interesting currency within itself, dollar trading dominates 30% of the overall FX market, and given the latest price action in the market and the retrace which is beginning. This analyst and a trader noticed something interesting, not all of the majors behaving equally as they had during the last stage of the 2000-2005 anti dollar rally, majors are diverging from each other, with antipodeans about to sail south and Canadian dollar will most likely follow the falling oil prices, and as soon as oil breaks below the $60 per mark, Loonie will most likely see the last of 1.2000 handle for sometime.
1-Day Currency Pair Outlook
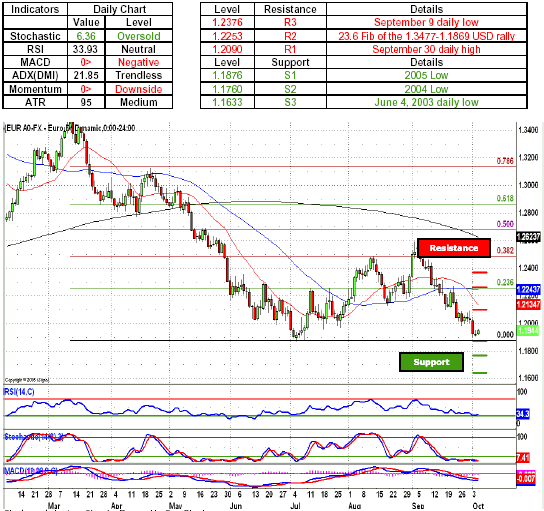
EUR/USD - Euro bulls launched a decisive counter attack against the dollar positions after the single currency longs managed to successfully defend the 2005 low at 1.1879. As the pair temporarily reverses its direction and heads back above the psychologically important 1.2000 handle, a further move to the upside will most likely see the euro bulls push their way toward the 1.2090, a level marked by the September 30 daily high. A break in the dollar defenses will most likely see the single currency longs test the greenback offers around 1.2135, a 20-day SMA, and with sustained momentum heading above the 1.2200 figure. A break above the 1.2200 will most likely see the retrace run its course as momentum stall around 1.2253, a level marked by the 23.6 Fib of the 1.3477-1.1869 USD rally. Indicators are favoring the dollar bulls with both momentum indicator and MACD below the zero line, while extremely oversold Stochastic gives the euro bulls a chance to retaliate.
Key Levels & Technical Indicators
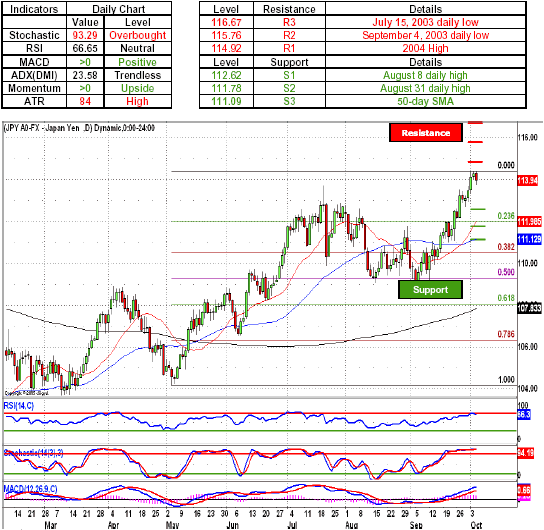
USD/JPY - Japanese Yen longs finally received a much needed break from the attacking greenback bulls as the price action came to a halt around 114.41, a new 2005 high and a gateway toward the psychologically important 115.00 handle. As the price action switches sides, a move to the downside will most likely see the yen longs push their way toward the 113.00 figure in an attempt to test the dollar defenses around 112.62, a level marked by the August 8 daily high. A further break in the dollar defenses will most likely see the yen bulls extend the retrace toward 111.78, a dollar defensive position established by the August 31 daily high, with retrace will most likely running its course around the 111.50 mark. Indicators remain supportive of the dollar longs with both momentum indicator and MACD treading above the zero line, while overbought Stochastic gives the yen longs a chance to retrace part of the dollar rally.
Key Levels & Technical Indicators
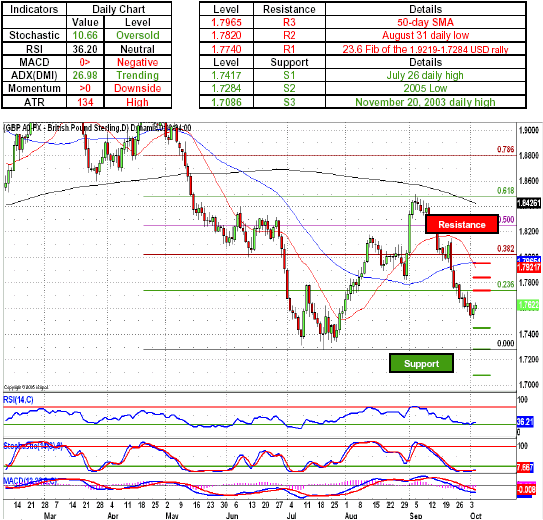
GBP/USD - British pound bulls continued to lead the charge against the greenback positions with the pair climbing above the 1.7600 figure during the start of much needed retrace. As cable longs make their way through the recaptured territory, a move to the upside will most likely see the sterling longs take on the greenback defenses around 1.7740, a level marked by the 23.6 Fib of the 1.9219-1.7284 USD rally. A break above will most likely see the pound bulls push their way toward the 1.7820, a level marked by the August 31 daily low and with a breakout aim straight for 1.7965, a 50-day SMA and a gateway to the psychologically important 1.8000 handle. Indicators favor the dollar bulls with ADX above 25 signaling trending conditions, while momentum indicator and MACD below the zero line, with oversold Stochastic adding to the out look that the price action continues to remain on the side of greenback longs.
Key Levels & Technical Indicators
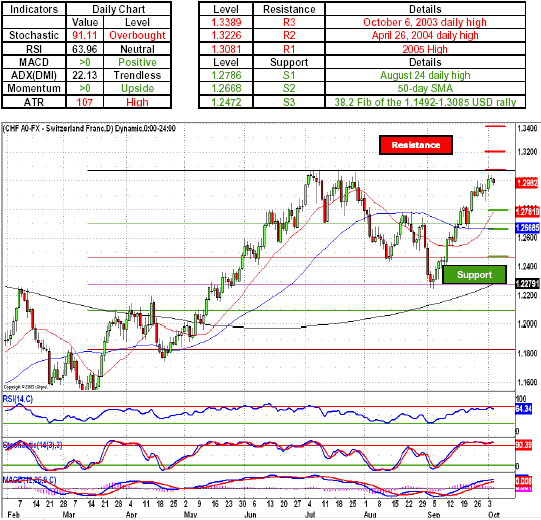
USD/CHF - Swiss Franc longs finally succeed in taking the upper hand in the struggle against the dollar bulls and at once pushed the pair below the 1.3000 figure. As the retrace ensues, a move to the downside will most likely see the pair head toward the 1.2900 figure, and with a breakdown to the downside taking on the greenback bids around 1.2800 figure, a level defended by the August 24 daily high at 1.2786. A further move to the downside will most likely see the Swissie longs push their way below the 1.2700 figure and take on the greenback defenses around 1.2668, a 50-day SMA, at which point the retrace will most likely run its course and the dollar dominated price action will return to the market. Indicators continue to favor dollar longs with both momentum indicator and MACD above the zero line. Stochastic remains extremely oversold thus giving the Swiss Franc longs a chance to retaliate.
Key Levels & Technical Indicators
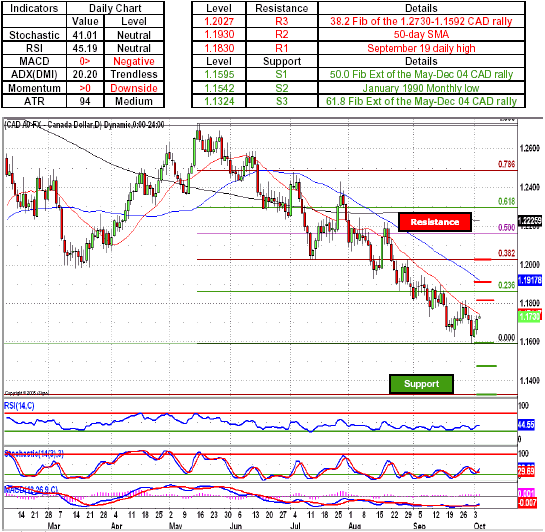
USD/CAD - Canadian dollar bulls retreated under a full onslaught from the greenback longs, as US dollar bulls had enough of the Loonie and pushed the pair higher, only to see their momentum stall around 1.1743, a level marked by the 20-day SMA. A pullback by the greenback longs will most likely see the Canadian dollar bulls once again test the multi year low at 1.1588, with a reversal from those levels most likely seeing the US dollar bulls retaliate in force and take on the Loonig longs in an attempt to push the pair back above the 1.1600 handle. Indicators continue to favor Canadian dollar bulls with both MACD and momentum indicator below the zero line, while neutral oscillators give US dollar longs enough room to maneuver.
Key Levels & Technical Indicators
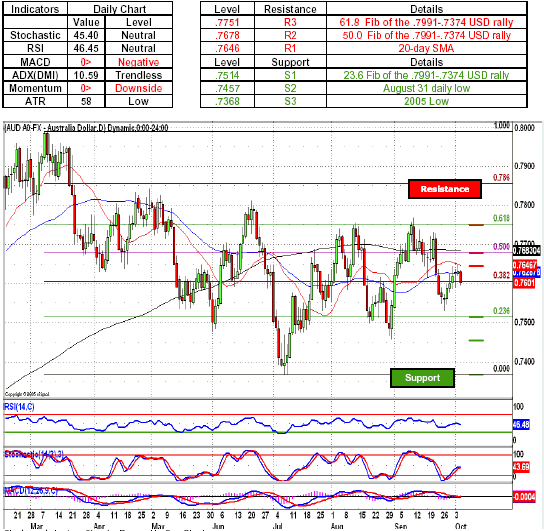
AUD/USD - Australian dollar longs failed to break the greenback defenses around the .7646, a level marked by the 20-day SMA and retreated below the .7600 handle. As reversal of fortune set in, the next move to the downside will most likely see the US dollar push the Australian dollar toward the .7514, a level marked by the 23.6 Fib of the .7991-.7374 USD rally, and with sustained momentum most likely seeing the pair head toward the .7457, an Aussie defensive position established by the August 31 daily low, thus breaking below the psychologically important .7500 figure. Indicators are favoring the US dollar bulls with both momentum indicator and MACD below the zero line. Stochastic became oversold, thus giving the Aussie longs a chance for a pullback.
Key Levels & Technical Indicators
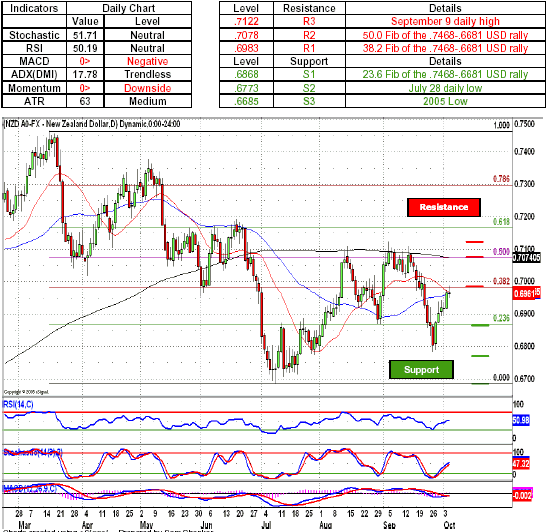
NZD/USD - New Zealand dollar bulls managed to break the US dollar defenses around the .6943, a level marked by the September 30 daily high, only to see the momentum of their advance vain into nothingness as confluence of the 20-day and 50-day SMA's around the .6965 level proved to much for the Kiwi bulls. A next move by the US dollar longs will most likely see the Kiwi longs retreat toward the .6800 figure, with a break to the downside most likely seeing the pair head toward the New Zealand dollar defenses around .6868, a level marked by the 23.6 Fib of the .7468-.6681 USD rally. A sustained momentum on the part of the greenback longs will most likely see the vanguard US dollar bulls take on the New Zealand dollar defenses around .6773, a July 28 daily low. Indicators remain in favor the US dollar bulls with both momentum indicator and MACD below the zero line; with oversold Stochastic adding to the outlook that the prolonged movement to the downside is here to stay.
Key Levels & Technical Indicators
Sam Shenker is a Technical Currency Analyst for FXCM.