Technical Overview
- Euro Rests Above 2005 Low
- British Pound Fights Back
- Swiss Franc Struggles Above 1.3000
Market Outlook
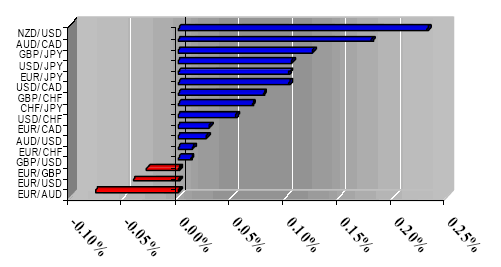
Dollar began showing saddle signs of move exhaustion despite recent price action which seen the dollar push most majors toward the 2005 levels, and in case of the Japanese yen new 2005 key levels. However even though the dollar manages to break below the 1.1876 against the euro, a retrace is in order for a new trend to take the dollar to the levels not seen in few years, given the overall feel of the market, this analyst and a trader believes that yesterdays sharp move had an "artificial flavor" to it, its lacked the natural movement of the market, it was forced and it did not flow as the natural price action should.
1-Day Currency Pair Outlook
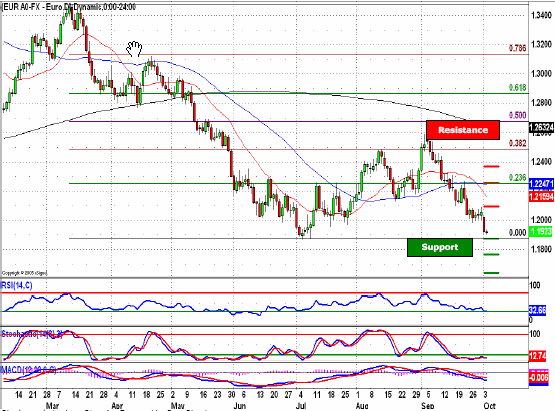
EUR/USD - Euro bulls once again fell under the unrelenting onslaught launched by the dollar longs as the pair fell through the psychologically important 1.2000 figure. As the price action remains in the vicinity of the 2005 Low, a move below the 1.1876, will most likely see the greenback longs push the pair toward the next major level at 1.1760, a 2004 Low. A further break in the single currency defenses will most likely see the pair test 1.1633, a level marked by the June 4, 2003 daily low, thus confirming a dollar dominated trend. However given the latest move to the downside raised a flag of caution, as a failure to break to the downside might signal a retrace. Indicators are favoring the dollar bulls with both momentum indicator and MACD below the zero line, while extremely oversold Stochastic adds to a trending outlook as most prolonged moves to the downside happened after oscillators became oversold.
Key Levels & Technical Indicators
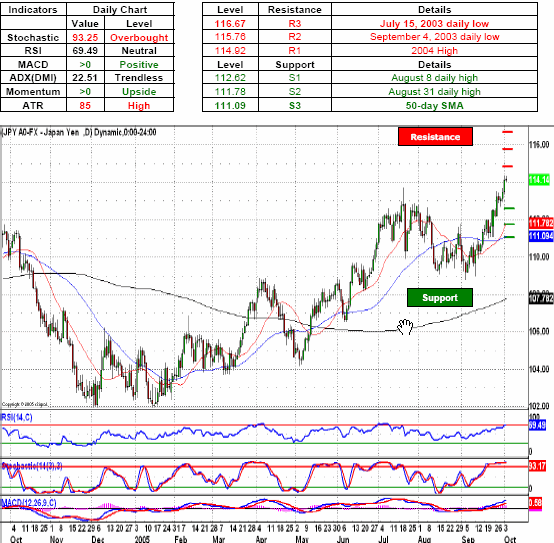
USD/JPY - Japanese Yen longs continued to retreat, with the latest move to the upside seeing the greenback longs breaching the 114.00 handle, thus setting their sights on the 115.00 figure. As dollar longs push their way toward 115.00, the next move to the upside will most likely see the pair head toward the Japanese yen defenses around 114.92, a 2004 high. A break above the 114.92 will most likely see the dollar longs push the pair above the psychologically important 115.00 handle and take on the yen defenses around 115.76, a level marked by the September 4, 2003, with further advance by the dollar bulls will most likely seeing the vanguard greenback longs take on the Japanese yen defenses around 116.67, a level marked by the July 15, 2003 daily high. Indicators remain supportive of the dollar longs with both momentum indicator and MACD treading above the zero line, while overbought Stochastic most likely acts as a confirmation for the possible trend.
Key Levels & Technical Indicators
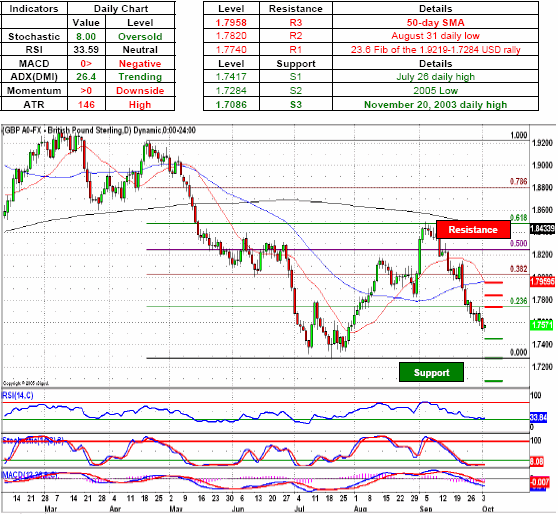
GBP/USD - British pound bulls remained as stoic as they could after being pounded by the dollar bulls, but still managing to hold on to the psychologically important 1.7500 handle. As the price action remains volatile, the next move to the downside will most likely see the greenback take on the sterling bids around 1.7417, a July 26 daily high. A further collapse of the sterling's defenses will most likely see the dollar bulls advance toward the 2005 Low at 1.7284, which currently acts as a gateway to the 1.7086, a level marked by the November 20, 2003 daily high. A break below the 1.7084 will most likely see the pair test the bids around the next psychologically important 1.7000 figure. However given the latest price action, a retrace might be a possibility with the sterling bulls aiming back toward the 1.8000 handle. Indicators favor the dollar bulls with ADX above 25 signaling trending conditions, while momentum indicator and MACD below the zero line, with oversold Stochastic adding to the out look that the price action will most likely remain on the side of the dollar longs.
Key Levels & Technical Indicators
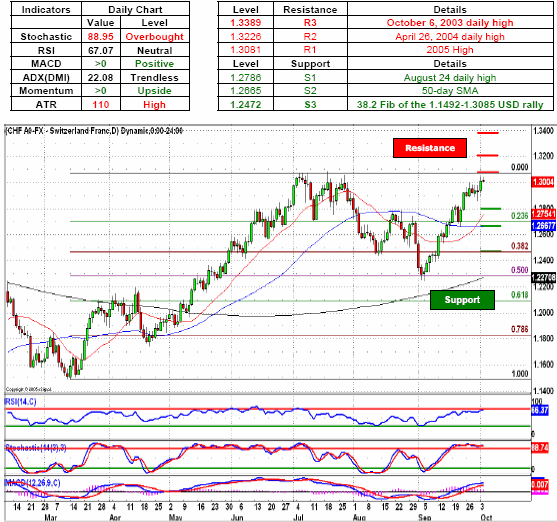
USD/CHF - Swiss Franc longs continued to fight with the dollar longs as the pair climbed above the psychologically important 1.3000 figure, with the next move to the upside most likely seeing the greenback head toward the Swissie defenses around 1.3081, a level marked by the 2005 High. A sustained break to the upside will most likely see the dollar longs push the pair toward the 1.3226, a Swiss Franc defenses established by the April 26, 2004 daily high, with further collapse of the CHF defenses seeing the greenback take on the Swissie offers around 1.3389, a level marked by the October 6 daily high. However given the extended move to the upside and a proximity of the 2005 high, a retrace became a possibility, but a further confirmation is required before any significant action is taken. Indicators continue to favor dollar longs with both momentum indicator and MACD above the zero line. Stochastic remains extremely oversold thus adding to the trending market outlook.
Key Levels & Technical Indicators
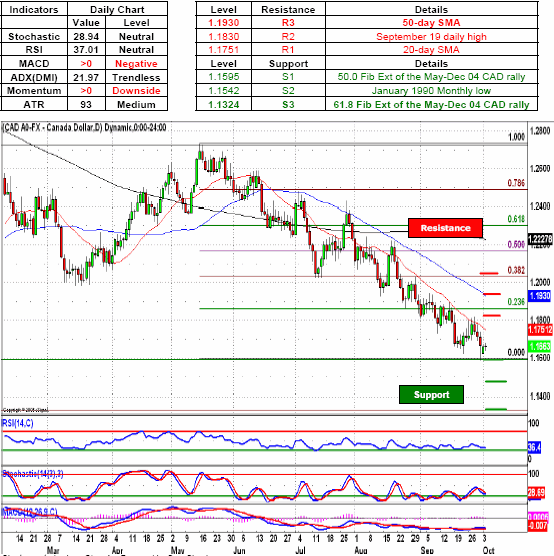
USD/CAD - Canadian dollar bulls remained in the world of its own as the price action remained confined to a multi-year lows around the 1.1600-1.1700 price range. As both sides get ready for another confrontation, a move below the current level will most likely see the Loonie bulls head toward 1.1542, a greenback defensive position established by the January 1990 monthly low. However a reversal from current levels will most likely see the US dollar test the Canadian dollar positions around 1.1751, a level marked by the 20-day SMA, with a further move to the upside testing the Loonie defenses around 1.1830, a level marked by the September 19 daily high. Indicators continue to favor Canadian dollar bulls with both MACD and momentum indicator below the zero line, while neutral oscillators give US dollar longs enough room to maneuver.
Key Levels & Technical Indicators
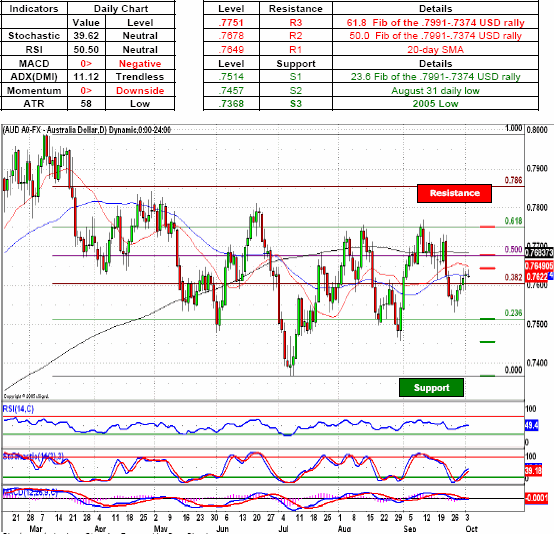
AUD/USD - Australian dollar longs remained on a sidelines as spectators as overall price action continued to pass them by with the pair orbiting the .7600 figure. As the price action remains subdued, a break in the greenback defenses will most likely see the Aussie longs push their way toward .7649, a level marked by 20-day SMA. However a reversal of fortune will most likely see the US dollar push the Australian dollar toward the .7514, a level marked by the 23.6 Fib of the .7991-.7374 USD rally. A next move to the downside will most likely see the pair head toward the .7457, an Aussie defensive position established by the August 31 daily low, thus breaking below the psychologically important .7500 figure. Indicators are favoring the US dollar bulls with both momentum indicator and MACD below the zero line. Stochastic became oversold, thus giving the Aussie longs a chance for a pullback.
Key Levels & Technical Indicators
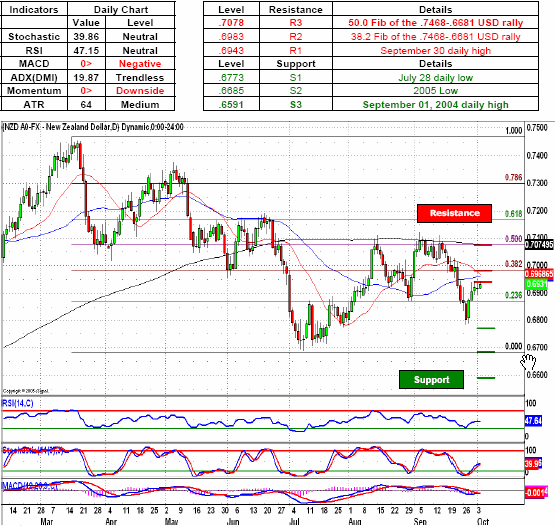
NZD/USD - New Zealand dollar bulls continued to throw themselves against the US dollar defenses in an attempt to break above the .6943, a level marked by the September 30 daily high. As both sides continue to engage in a showing match, a break above the greenback defenses will most likely see the New Zealand dollar longs push toward the .6983, a level marked by the 38.2 Fib of the .7468-.6681 USD rally, which acts as a gateway toward the psychologically important .7000 figure. However a decisive move by the US dollar longs will most likely see the Kiwi longs retreat toward the .6800 figure, with a break to the downside most likely seeing the pair head toward the New Zealand dollar defenses around .6773, a July 28 daily low. Indicators remain in favor the US dollar bulls with both momentum indicator and MACD below the zero line; with oversold Stochastic adding to the outlook that the prolonged movement to the downside is here to stay.
Key Levels & Technical Indicators
Sam Shenker is a Technical Currency Analyst for FXCM.