Technical Overview
- Euro Tries For 1.2100
- Japanese Yen Remains Above 113.00
- New Zealand Dollar Makes Sharp Retrace
Market Outlook
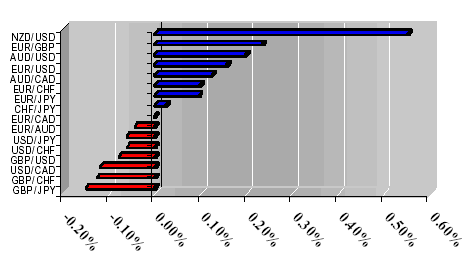
Dollar longs became a little nervous as the price action stalled, however for any large move to occur someone has to be on the wrong side of it and the current retrace is only a precursor, even if it's over 100 pips. As the dollar remains the underdog of the market, most traders fail to realize that the greenback posted significant gains since January and retraces are only a part of the overall price action. Those who jump to conclusions to fast often fail to land softly.
1-Day Currency Pair Outlook
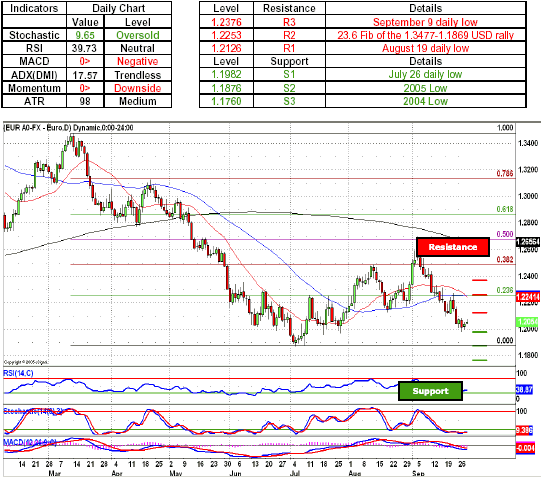
EUR/USD - Euro bulls continued to slowly advance against the dollar longs as the latest counterattack is nothing more than a retrace that usually precedes a large move. As the dollar bulls give up some of the recently conquered territory, a pullback toward the 1.2126, a level marked by the August 19 daily low will most likely see the greenback longs spring a trap upon unsuspecting euro bulls. An upcoming counterattack will most likely see the pair gather enough momentum and break below the psychologically important 1.2000 handle and with sustained momentum seeing the dollar longs pushing the single currency below the 1.1982, a July 26 daily low. As greenback bulls remain unopposed and continue their march though the euro held territory the next move to the downside will most likely see the pair head lower and test the single currency defenses around 1.1876, a defensive position established by the 2005 Low. A break of the current 2005 low at 1.1876 will most likely see the single currency surrender further ground to the greenback as it would confirm a dollar dominated trend and see the pair head toward the next major level at 1.1760, a 2004 Low. Indicators are favoring the dollar bulls with both momentum indicator and MACD below the zero line, while extremely oversold Stochastic adds to a trending outlook as most prolonged moves to the downside happened after oscillators became oversold.
Key Levels & Technical Indicators
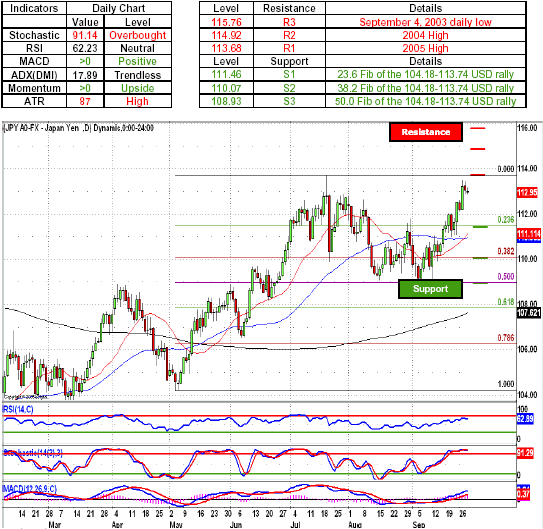
USD/JPY - Japanese Yen longs continued to raise a flag on the mast that was the sharp move by the dollar longs during September 27 greenback offensive. As the price action remains stagnant, a retrace toward the 112.52, a September 23, daily high will most likely see the dollar bulls spring into action and once again push the Japanese yen longs above the 113.00 figure and resume their advance toward 113.68, a 2005 high and a gateway to the psychologically important 115.00 handle. As greenback longs approach 115.00 handle they will most likely have to contend with the Japanese yen defenses around 114.92, a 2004 high. A break above the 114.92 will most likely see the greenback bulls push the pair above the psychologically important 115.00 handle and take on the yen defenses around 115.76, a level marked by the September 4, 2003, Indicators remain supportive of the dollar longs with both momentum indicator and MACD treading above the zero line, while overbought Stochastic most likely acts as a confirmation for the possible trend that started around the 109.00 handle.
Key Levels & Technical Indicators
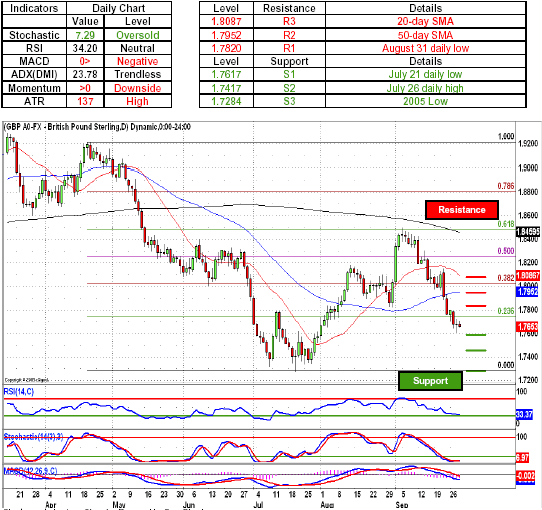
GBP/USD - British pound bulls remained indecisive after managing to stall the dollar advance only to see their counterattack failing to gain momentum. As sterling longs remain in a limbo, a move to the upside will most likely see their advance to be nothing more than a gesture as cable bulls will most likely not make it passed the dollar defenses around 1.7740, a level marked by the 23.6 Fib of the 1.9219-1.7284 USD rally. Retaliation on the part of the dollar longs will most likely see the pound forces hastily retreat below the psychologically important 1.7500 figure thus surrendering the 1.7617, a July 21 daily low to the greenback longs. As sterling longs continue to head south towards the 2005 Low at 1.7284, they will most likely try to mount a counteroffensive around 1.7417, a level marked by the July 26 daily high. Indicators favor the dollar bulls with momentum indicator and MACD below the zero line, while oversold Stochastic adds to the out look that the price action will most likely remain on the side of the dollar longs.
Key Levels & Technical Indicators
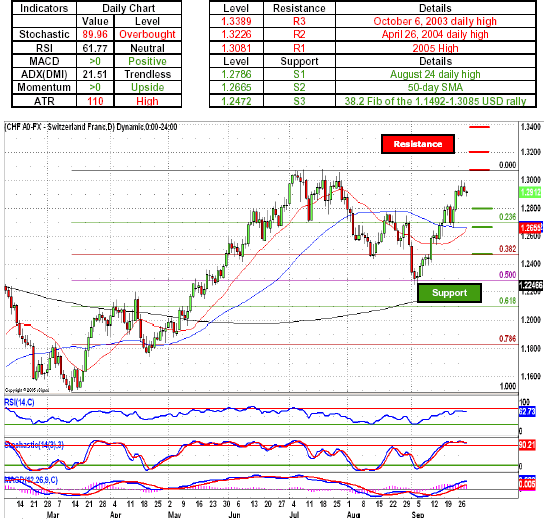
USD/CHF - Swiss Franc longs once again failed to gain momentum below the 1.2900 figure as the price action remained on the side of advancing dollar bulls. As greenback longs finish consolidating their gains and resume their advance toward the psychologically important 1.3000 figure, the next move by the dollar bulls will most likely see the pair advance toward the Swiss Franc defenses around 1.3081,a level marked by the 2005 High. A sustained break to the upside will most likely see the dollar longs push the pair toward the 1.3226, a CHF defensive position established by the April 26, 2004 daily high. A further advance by the dollar bulls will most likely see the pair retreat toward the 1.3389, a level marked by the October 6, 2003. Indicators continue to favor dollar longs with both momentum indicator and MACD above the zero line. Stochastic remains extremely oversold thus adding to the trending market outlook.
Key Levels & Technical Indicators
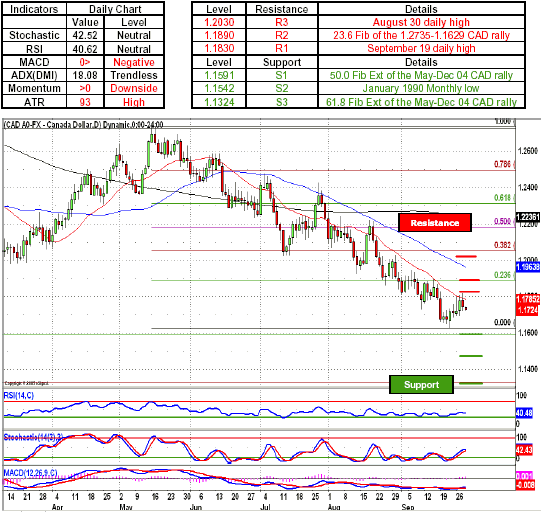
USD/CAD - Canadian dollar bulls remained in the world of their own as both sides remains locked in combat as the price action remained within vicinity of the multi-year lows for the USD/CAD. As the pair remains confined to the critical levels, a successful counterattack by the dollar longs will most likely see the pair head higher and break above the 1.1784, a level marked by the 20-day SMA, with the next move to the upside most likely seeing the US dollar push the pair against the Canadian dollar defenses around 1.1830, a level marked by the September 19 daily high. A further advance by the greenback will most likely see the Loonie retreat toward 1.1890, a level established by the 23.6 Fib of the 1.2735-1.1629 CAD rally, with sustained momentum likely seeing the US dollar take on the CAD bulls around 1.1973, a level marked by the 50-day SMA. Indicators continue to favor Canadian dollar bulls with both MACD and momentum indicator below the zero line, while neutral oscillators give US dollar longs enough room to maneuver.
Key Levels & Technical Indicators
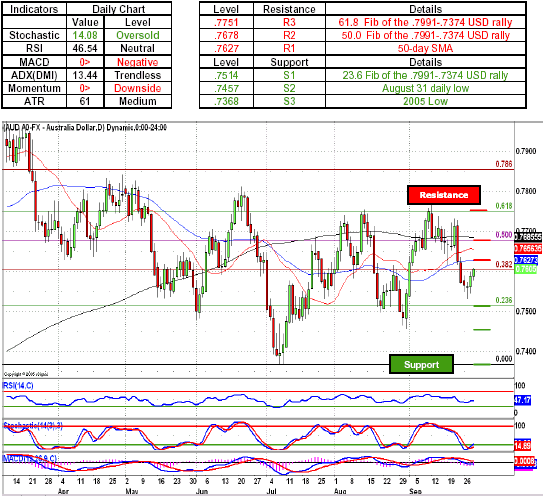
AUD/USD - Australian dollar longs managed to further their advance against their US counterpart as Aussie bulls pushed above the .7600 figure only to see their momentum stall as pair came upon the dollar defenses around .7605, a level marked by the 38.2 Fib of the .7991-.7374 USD rally. As the greenback bulls sharpen their horns and retaliate in force, the next USD dominated move will most likely see the Australian dollar longs fall back toward the .7514, a level marked by the 23.6 Fib of the .7991-.7374 USD rally. A next move to the downside will most likely see the pair head toward the .7457, an Aussie defensive position established by the August 31 daily low, thus breaking below the psychologically important .7500 figure. A sustained momentum on the part of the greenback longs will most likely see the pair head toward the .7368, a 2005 low and a gateway to the next psychologically important level at .7000. Indicators are favoring the US dollar bulls with both momentum indicator and MACD below the zero line. Stochastic became oversold, thus giving the Aussie longs a chance for a pullback.
Key Levels & Technical Indicators
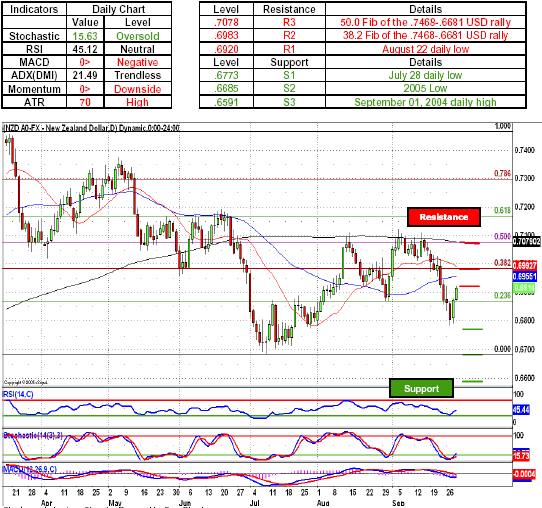
NZD/USD - New Zealand dollar bulls has take the saying "Barbarians at the Gate" literally and pushed the greenback longs back toward their defensive positions around .6920. As the battle between Kiwi bulls and US dollar longs heats up, the next move by the greenback will be a decisive one as the push below the .6900 figure will most likely see the New Zealand dollar bulls lose their footing with the pair collapsing toward the .6800 figure. A break to the downside will most likely see the pair head toward the New Zealand dollar defenses around .6773, a July 28 daily low. with a further break in the Kiwi's defenses seeing the NZD retreat toward the .6685, a critical level marked by the 2005 low, breaking of which will most likely see the pair test the NZD bids around .6591, a level marked by the September 1, 2004 daily high, which currently acts as a gateway toward the psychologically important .6500 handle. Indicators favoring the US dollar bulls with both momentum indicator and MACD below the zero line; with oversold Stochastic adding to the outlook that the prolonged movement to the downside is here to stay.
Key Levels & Technical Indicators
Sam Shenker is a Technical Currency Analyst for FXCM.