- AUD/CAD
- AUD/JPY
- AUD/NZD
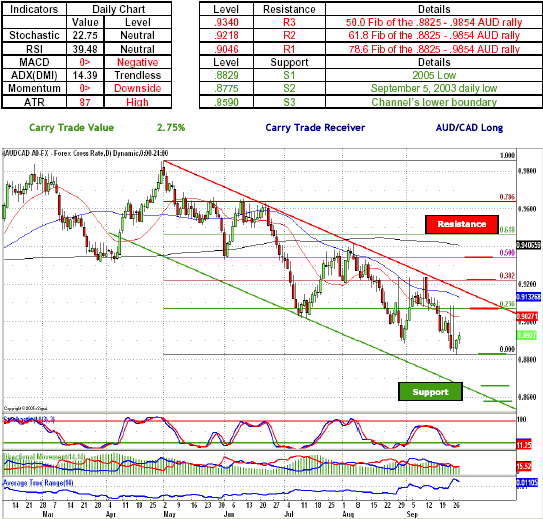
AUD/CAD - Canadian dollar longs once again found themselves starring at the psychologically important .9000 handle from below as the cross stalled around the .8826, a level marking the lows set by the cross on September 9,. 2004. As the price action remains volatile, a move to the upside will most likely see the Australian dollar longs take on the Loonie defenses around .9046, a 78.6 Fib of the .8825-.9584 Australian dollar rally, with a break above most likely see the Aussie longs gather enough momentum and breakthrough the .9100 handle. However a continuation of the Loonie rally will most likely see the AUD/CAD break below the 2005 Low at .8829 and head toward the .8775, a level marked by the September 5, 2003 low. Indicators remain in favor of CAD longs with both MACD and momentum indicator below the zero line, while neutral oscillators give either side enough room to maneuver.
Key Levels & Technical Indicators

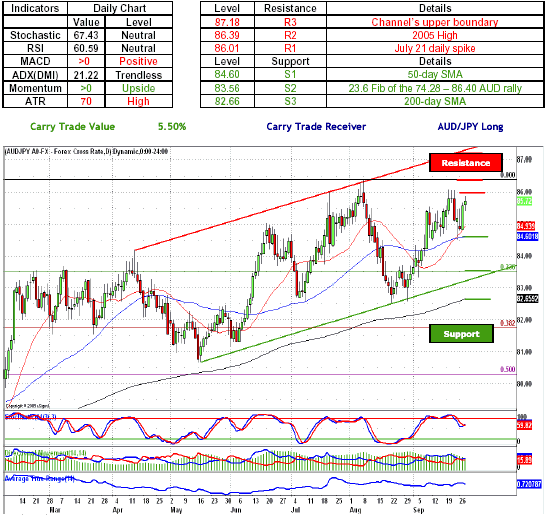
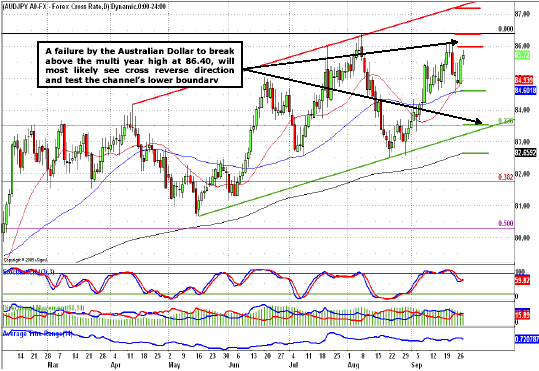
AUD/JPY - Japanese yen bulls remained under pressure as cross continued to bounce against the 86.00 figure with Australian dollar failing to retest the multi year high at 86.39. A successful defense of the 86.00 figure by the Japanese yen longs will most likely see the cross retreat toward the psychologically important 85.00 figure, with a break to the downside seeing the cross test the bids around 84.60, a first line of Australian dollar defenses established by the 50-day SMA. A further breakdown will most likely see the yen bulls force their way toward 83.56, an Aussie line of defense established by the 23.6 Fib of the 74.23 -86.40 AUD rally thus opening the cross for a subsequent move below the 83.00 handle. Indicators support Aussie longs with both momentum indicator and MACD above the zero line, while neutral oscillators give either side enough room to maneuver.
Key Levels & Technical Indicators

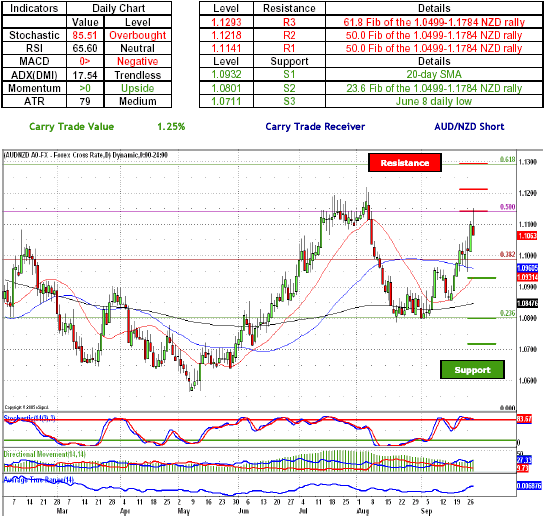
AUD/NZD - New Zealand dollar bulls managed to stage a counterattack against the Australian dollar counterparts as the cross failed to break the above the New Zealand dollar offers around 1.1141, a 50.0 Fib of the 1.0499-1.1784 NZD rally. As Aussie bulls retest the Kiwi's bids a subsequent turnaround will most likely see the cross reverse direction and head toward the 1.0990, a level marked by the 38.2 Fib of the 1.0499-1.1784 NZD rally. A further break to the downside will most likely see the New Zealand dollar push the AUD/NZD toward the 1.0801, a defensive position established by the 38.2 Fib of the 1.0499-1.1784 NZD rally. Indicators are signaling divergence, with MACD below the zero line diverging from the momentum indicator above the zero line, while ADX rose to 28.12, signaling trending conditions. Stochastic remains overbought thus giving Kiwi longs a chance to recover.
Key Levels & Technical Indicators

Chart of the Moment

Sam Shenker is a Technical Currency Analyst for FXCM.