Technical Overview
- Euro Sees 1.1700 In Its Future
- British Pound Crashes Trough 1.8000
- Japanese Yen Tests The Range At 112.50
Market Outlook
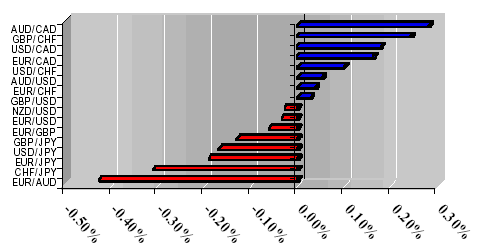
Dollar has weathered another storm in more ways than one, and is now getting ready to reassert its dominance over the majors as many psychologically important levels and 2005 Highs/Lows (depending on the pair) are seeing the sights set on them by the greenback bulls. As the next major move is already underway, the likelihood of a major trend will increase if the dollar manages to break the previously established 2005 levels.
1-Day Currency Pair Outlook
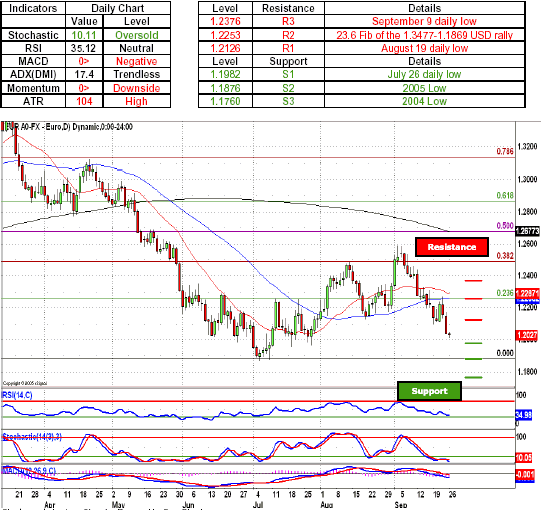
EUR/USD - Euro bulls once again found themselves on the receiving end of the greenback advance as the pair edged closer to the psychologically important 1.2000 handle. As the price action remains on the side of the dollar longs, a pullback toward the 1.2126, a level marked by the August 19 daily low will most likely see the pair head back toward the psychologically important 1.2000 handle and with a move to the downside most likely see the greenback bulls make their way toward the 1.1982, a July 26 daily low. A next move to the downside will most likely see the euro longs retreat toward the 1.1876, a defensive position established by the 2005 Low, with a major breakout targeting 1.1760, a 2004 Low and a gateway to the psychologically important 1.1500 handle. Indicators are favoring the dollar bulls with both momentum indicator and MACD below the zero line, while extremely oversold Stochastic might give the euro bulls a chance for a retrace.
Key Levels & Technical Indicators
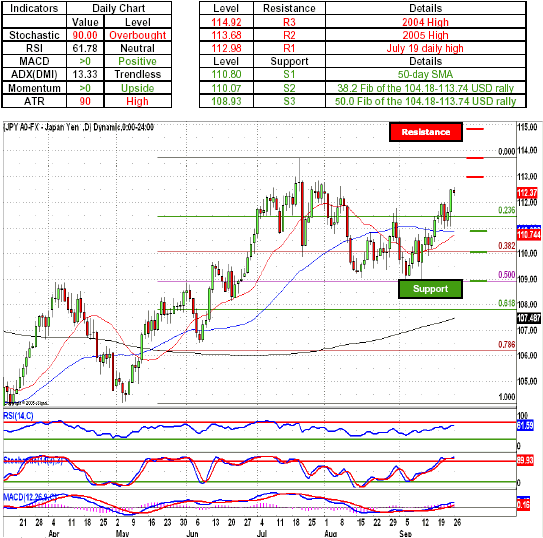
USD/JPY - Japanese Yen longs were in full retreat after the dollar bulls resumed their advance, ferociously attacked the yen positions and succeeded in pushing the pair above the 112.00 figure, which capped the price action for the most of previous week. As yen longs continue to surrender more territory to the greenback bulls, a sustained momentum to the upside will most likely see the dollar longs take on the yen defenses around 112.98, a level marked by the July 19 daily high. A further move to the upside will most likely see the greenback longs push the pair toward the 113.68, a 2005 high and a gateway to the psychologically important 115.00 handle, which is being defended by the 114.92, a 2004 high. Indicators are supporting dollar longs with both momentum indicator and MACD treading above the zero line, while overbought Stochastic gives Japanese yen longs a possibility to push back the advancing dollar longs.
Key Levels & Technical Indicators
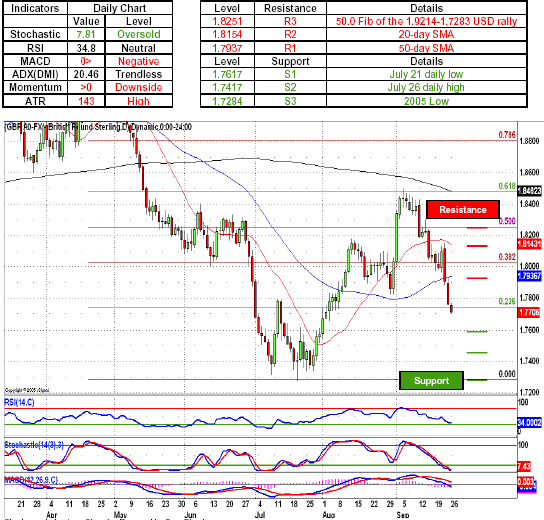
GBP/USD - British pound bulls received no break from the marauding dollar longs as the pair continued to head lower after the greenback bulls managed to unwind the thread that held the cable above the psychologically important 1.8000 handle. As the price action stalls around the 1.7740, a level marked by the, 23.6 Fib of the 1.9214-1.7283 USD rally, pullback toward the 1.7800 figure will most likely see the dollar bulls gather enough momentum to push the pound longs lower toward the 1.7617, July 21 daily low. A further collapse of the sterling defenses will most likely see the cable head below the psychologically important 1.7500 figure, as greenback longs take on another level of pound defenses at 1.7417, a level marked by the July 26 daily high. Indicators favor the dollar bulls with momentum indicator and MACD below the zero line, while oversold Stochastic might give the pound longs a chance to retaliate.
Key Levels & Technical Indicators
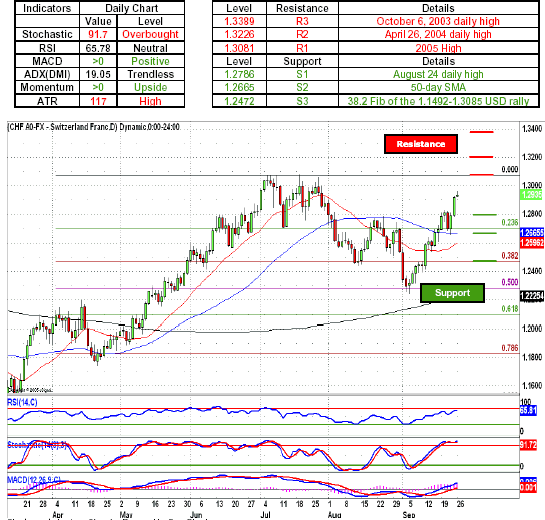
USD/CHF - Swiss Franc longs were in disarray after their counterattack was stopped in its tracks, with the dollar bulls pushing the pair above the 1.2800 figure like it did not exist. As Swissie bulls once again test their luck, a pullback toward the 1.2800 figure will most likely see the greenback longs that were late to the start of the dollar party, take an advantage of the retrace and push the pair toward the psychologically important 1.3000 figure, with a break to the upside seeing the pair head toward the 2005 High at 1.3081. A further break to the upside will most likely see the dollar longs push the Swssie longs toward the 1.3226, a defensive position established by the April 26, 2004 daily high. Indicators continue to favor dollar longs with both momentum indicator and MACD above the zero line. Stochastic remains extremely oversold thus signaling a possible start of a trend.
Key Levels & Technical Indicators
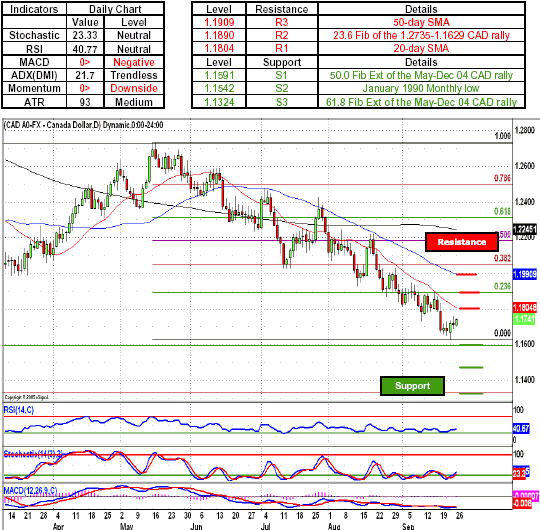
USD/CAD - Canadian dollar bulls began to buckle under pressure of their own weight with the pair most likely reaffirming a long-term double bottom established by the 1.1600-1.1750 range. As the price action shifts sides and begins to favor the US dollar longs, a move above the 1.1804 will most likely see the pair take out the 20-day SMA and aim for the Loonie offers around 1.1890, a level marked by the 23.6 Fib of the 1.2735-1.1629 CAD rally. A further move to the upside will most likely see the greenback take on the Canadian dollar bulls around 1.1909, a level marked by the 50-day SMA, and with a further collapse of the CAD defenses seeing the pair head above the psychologically important 1.2000 handle and take on the next round of Loonie defenses around 1.2051. a 38.2 Fib of the 1.2735-1.1629 CAD rally. Indicators continue to favor Canadian dollar bulls with both MACD and momentum indicator below the zero line, while neutral oscillators give US dollar longs enough room to maneuver.
Key Levels & Technical Indicators
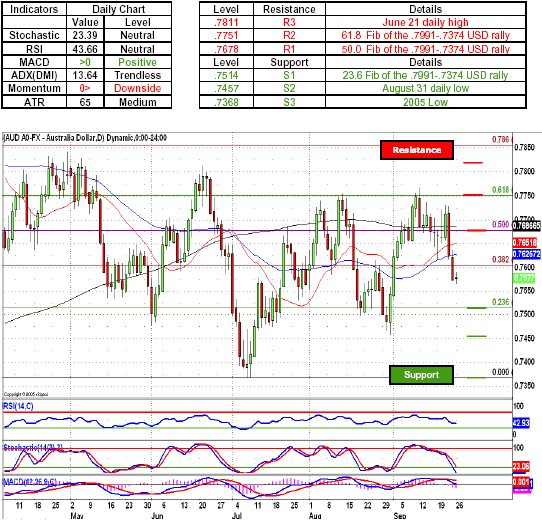
AUD/USD - Australian dollar longs fell though the .7600 figure after the greenback bulls managed to reestablish their dominance. As Aussie longs continue to retreat, a pullback toward the .7620 line will most likely see the US dollar longs come out in force and push their Australian dollar counterparts toward the psychologically important .7500 handle, a level that is being defended the 23.6 Fib of the .7991-.7374 USD rally at.75142. A sustained momentum on the part of the US dollar longs will most likely see the pair head toward the .7457, an Aussie defensive position established by the August 31 daily low. Indicators signal a move to the downside with Stochastic treading above the overbought line, while positive MACD is beginning to diverge from the momentum indicator that is treading below the zero line.
Key Levels & Technical Indicators
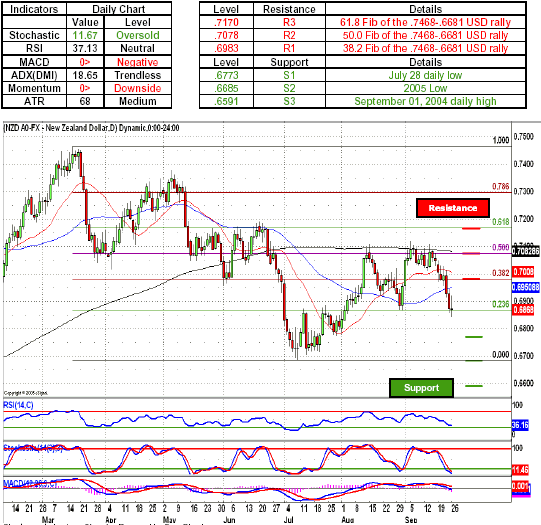
NZD/USD - New Zealand dollar bulls fell like a rock after the Kiwi left its next above the psychologically important .7000 handle. As New Zealand dollar longs continue to tumble and hit every major level on their way down, a further collapse will most likely see the pair test the NZD defenses around .6773, a July 28 daily low. A further break in the Kiwi's defenses will see the flightless pair tumble toward the .6685, a critical level marked by the 2005 low, a breaking of which will most likely see the pair test the New Zealand dollar bids around .6591, a level marked by the September 1, 2004 daily high. A further collapse of the Kiwi's defenses will most likely see the greenback test the psychologically important .6500 handle, a level not seen in over a year. Indicators favoring the US dollar bulls with both momentum indicator and MACD below the zero line; with oversold Stochastic giving the New Zealand dollar longs a probability of a pullback.
Key Levels & Technical Indicators
Sam Shenker is a Technical Currency Analyst for FXCM.