Technical Overview
- Euro Stalls Above 1.2200
- Japanese Yen Bounces In Narrow Range
- Canadian Dollar (USD/CAD) Pushes Greenback Lower
Market Outlook
Dollar remains in a limbo as traders continue to price in the impact of another hurricane set to strike the US coast within next 36 hours. As the market continue to remain volatile, creating perfect trading conditions for the volatility and short term traders. However a long-term position trader such as this analyst advises to stay out until a clear direction is chosen by the market.
1-Day Currency Pair Outlook
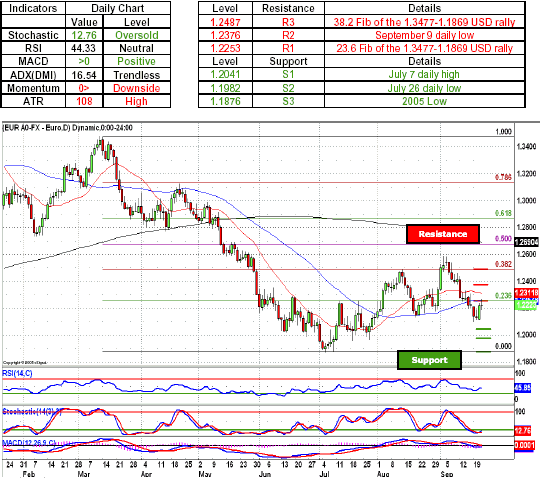
EUR/USD - Euro bulls continued their surprising attack against the greenback positions as single currency made its way above the 1.2200 handle during the latest bout of the anti-dollar sentiment. As the price action stalls around the 1.2253, a greenback defensive position established by the 23.6 Fib of the 1.3477-1.1869 USD rally, which is further being reinforced by the 50-day SMA, combined together make for a formidable line of defense for the dollar bulls. As the pair remains above the 1.2200 figure, an inability by the euro longs to push the EUR/USD higher only strengthen the outlook for the dollar bulls, which may use this retracement as a potential to establish new greenback positions. However a break above the 1.2253, will most likely see the dollar retreat to 1.2376, a level marked by the September 9 daily low, but given the outlook that the move against the dollar is a mere gesture, the next major move will most likely see the dollar push toward the 1.2100 handle. A sustained momentum to the downside will most likely see the pair braking below the 1.2041, a euro defensive position established by July 7 daily high, which currently acts as a gateway to the psychologically important 1.2000 barrier. Indicators are favoring the dollar bulls with both momentum indicator and MACD below the zero line, while extremely oversold Stochastic gives the euro bulls a chance for a retrace.
Key Levels & Technical Indicators
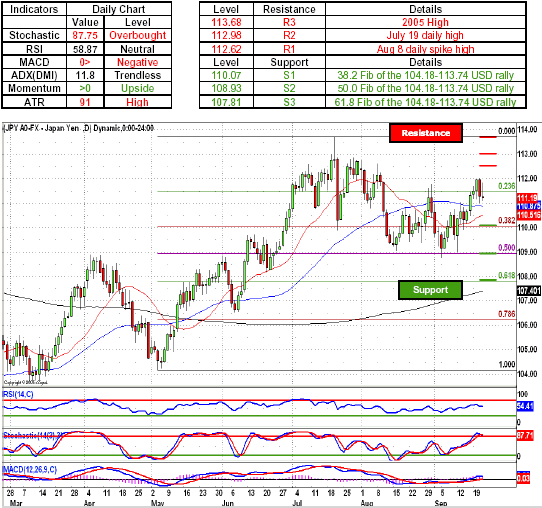
USD/JPY - Japanese Yen longs were on a warpath again as the pair remained confined to a narrow trading range and established a tweezer top reversal pattern that signals a short term pullback. A move to the downside will most likely see the yen longs have a tough time achieving a sustainable momentum below the 111.00 figure, as a move to the downside will instantly encounter 50-day SMA at 110.87, followed by the 20-day SMA at 110.51, both of which help the dollar to defend the psychologically important 110.00 handle that is further defended by the 38.2 Fib of the 104.18-113.74 USD rally. Given the unsustainably of the yen rally, a failure by the yen longs to make much headway below the 111.00 figure, will most likely give the battered greenback bulls a chance to retaliate and push the yen bulls above the 112.00 figure. If the dollar longs want to make their way toward the 113.00 figure, its imperative that they gather momentum above the 112.00 level and push the pair above the 112.62, an August 8 daily spike high. Indicators are diverging with momentum indicator above the zero line and MACD sloping upward toward the zero line, while overbought Stochastic gives Japanese yen longs a chance to push the pair lower.
Key Levels & Technical Indicators
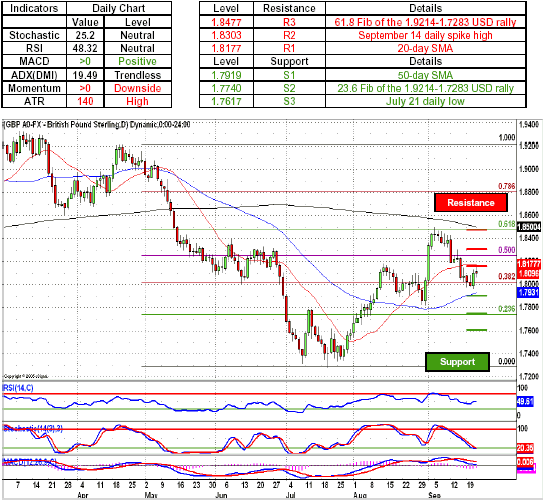
GBP/USD - British pound bulls joined the other majors in their action against the greenback and pushed the pair above the 1.8100 figure, despite a brief foray below the psychologically important 1.8000 handle. A failure by the cable longs to unwind dollar defense around the 1.8177, a 20-day SMA constitutes a retrace and the next move will most likely see the pair head below the 1.8100 figure and once again aim for the bids around the psychologically important 1.8000 handle. A break below will most likely see the greenback head toward the pound bids around the 1.7919, a defensive position established by the 50-day SMA. A further break to the downside to the downside will most likely see the pair test the cable's defenses around the 1.7740, 23.6 Fib of the 1.9214-1.7283 USD rally.. Indicators are beginning to diverge with momentum indicator below the zero line, while the MACD is sloping downward toward the zero line with neutral oscillators give either side plenty of room to maneuver.
Key Levels & Technical Indicators
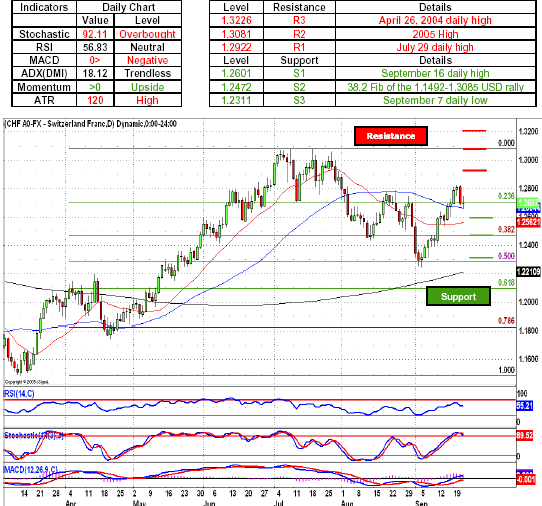
USD/CHF - Swiss Franc longs made a gesture as they pushed the pair below the 1.2700 figure, only to see their initial momentum wane as the vanguard Swissie bulls became bogged down around the 1.2664 line, marked by the 50-day SMA. Also a 23.6 Fib of the 1.1492-1.3085 USD rally at 1.2705 is currently hindering the progress of the Swiss Franc advance as the pair failed to gather sufficient momentum to retake more territory lost to the dollar advance. As the price action turns into favor of the greenback longs a move to the upside will most likely see the pair head higher and test the Swissie defenses around the 1.2800 figure, which is being marked by the evening star reversal pattern which is also reinforced by the hangman candle pattern. Indicators continue to favor dollar longs with both momentum indicator and MACD above the zero line. Stochastic became oversold giving Swissie longs a chance to push further into the dollar held territory.
Key Levels & Technical Indicators
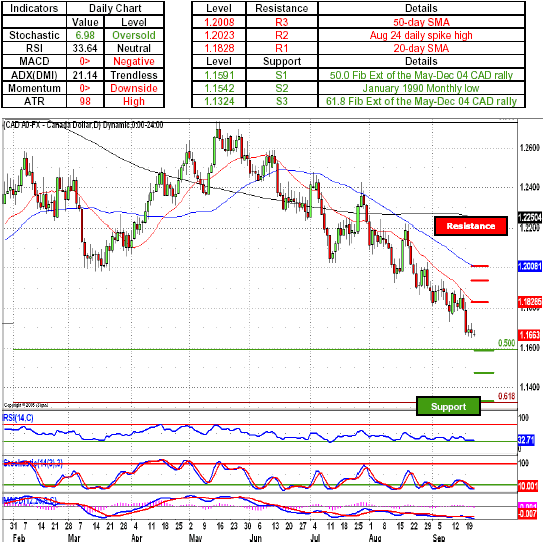
USD/CAD - Canadian dollar bulls remained undeterred as they continued to push their way deeper into the greenback held territory. As the price action between the US dollar and the CAD becomes more volatile, the next move to the downside will most likely see the pair test the US dollar defenses around the 1.1591, a 50.0 Fib Ext of the May-Dec 04 CAD rally with a further move to the downside taking on the 1.1542, a January 1990 Monthly low. A further move to the downside will most likely see the pair head to the territory not see in over a decade with the next major low seen at 1.1189 established during the December of 1991.
Indicators continue to favor Canadian dollar bulls with both MACD and momentum indicator below the zero line. However an extremely oversold Stochastic is giving the US dollar longs a chance for a pullback that can turn into a pivot.
Key Levels & Technical Indicators
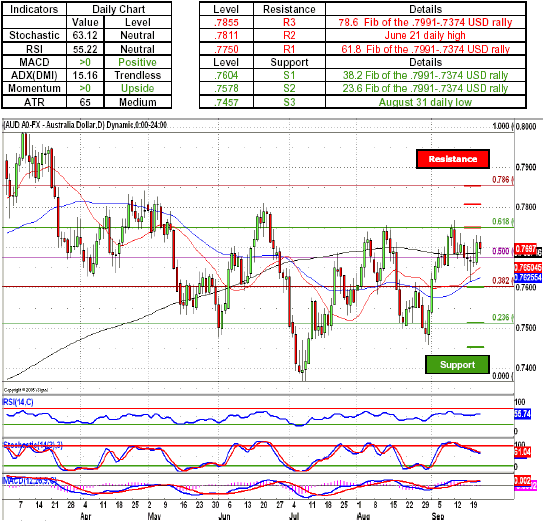
AUD/USD - Australian dollar longs continued to revolve around the .7700 figure as the pair seems to be attracted by the combination of the 50.0 Fib of the .7991-.7374 USD rally and the 200-day SMA as neither side made much progress. As greenback bulls gather their forces and push the pair back below the .7650 and test the Aussie bids around .7604, a break below the .7600 handle will most likely see the pair head toward .7512, a level marked by the 23.6 Fib of the .7991-.7374 USD rally, with sustained momentum to the downside seeing the US dollar longs take on the Aussie defenses around the psychologically important .7500 handle. Indicators signal a move to the downside with Stochastic treading above the overbought line, while positive MACD and momentum indicators continuing to favor Aussie longs.
Key Levels & Technical Indicators
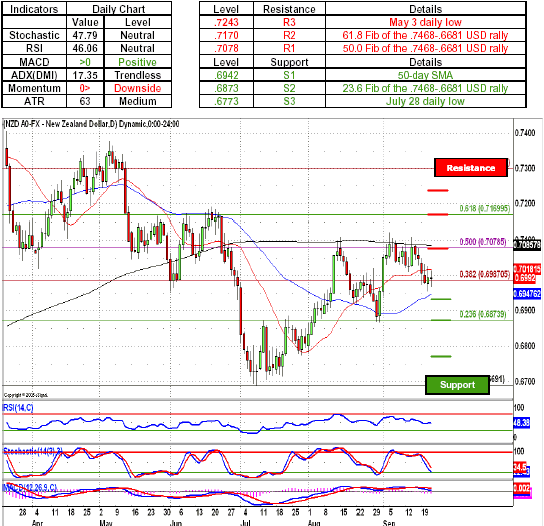
NZD/USD - New Zealand dollar bulls decided not to join the other majors in the counterattack against the US dollar and decisively surrendered the psychologically important .7000 figure to the greenback. As the US dollar longs reassert their dominance over the price action, a sustained move below the .6986, a level marked by the key 38.2 Fib of the .7468-.6681 USD. A sustained momentum on the part of the US dollar longs will most likely see the pair head toward the .6942, a 50-day SMA and with a further move to the downside taking on the .6873, a 23.6 Fib of the .7468-.6681 USD rally. Indicators are diverging with momentum indicator below the zero line while MACD is sloping to the downside above the zero line, with neutral oscillators giving either side enough room to maneuver.
Key Levels & Technical Indicators
Sam Shenker is a Technical Currency Analyst for FXCM.