| Long-Term Outlook Favors Short-Term Trading |
| By Price Headley |
Published
10/9/2008
|
Currency , Futures , Options , Stocks
|
Unrated
|
|
|
|
Long-Term Outlook Favors Short-Term Trading
In crazy market times like this, I find it helpful to look back at history to see where we are in the big picture. History often repeats itself, and as the old saying goes, "those that do not know understand history are often doomed to repeat it." We have seen many unusual events happen in the markets over the past 15 to 20 years:Currency Crises, Long-Term Capital, Internet Bubble, Real Estate Bubble, 9/11, 1990s Mega Bull Market, Oil/Commodity Bubble, and Emerging Market crashes. So we have the experience and knowledge to know how to weather and profit from these kinds of circumstances.
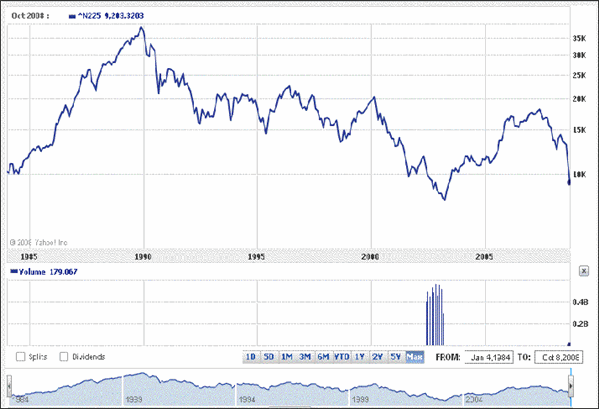
To me the best comparison for our markets from a long-term perspective, specifically the NASDAQ 100 (QQQQ ETF), is the 20-year performance of Japan's Nikkei 225 Index.
Nikkei 225 Long-Term Chart

You can see that the Nikkei peaked out at "bubble" levels just before 1990. In the 18 years since then, the market has basically been in a downward trending range. Of course, there are huge short-term trading opportunities on both the long and short side within that chart. You can also note that we are fast approaching the lowest lows in that time period.
Next look at the following QQQQ chart from the peak of the Internet Bubble in 2000 to now:
NASDAQ 100 Index (QQQQ) Long-Term Chart

This chart covers only about 9 years, but is strikingly similar to the Nikkei chart in my view. Since the bubble burst, we have basically been in a trading range, and we look unlikely to reach the old highs (around 5,000 on the NASDAQ Composite was the famous top) for quite some time. If you use the Nikkei chart as a model for the NASDAQ, then we are likely to have up to 10 more years of a choppy, ultimately range-bound market.
I think it is good to keep this long-term outlook in mind, so you don't get too long-term bullish or bearish when things are swinging strongly in one direction. But there are still plenty of short-term trading moves and trends within the long-term chart that can be potentially very profitable for leveraged short-term options trading.
The bottom line is that "buy-and-hold" and Index Funds have not worked well and will not work well in the current environment. In my view, trend/momentum trading and shorter-term holding periods are more suitable to the current environment.
Price Headley is the founder and chief analyst of BigTrends.com.
|