| Outlook On The Stock Indices |
| By Price Headley |
Published
09/7/2008
|
Stocks
|
Unrated
|
|
|
|
Outlook On The Stock Indices
NASDAQ Composite
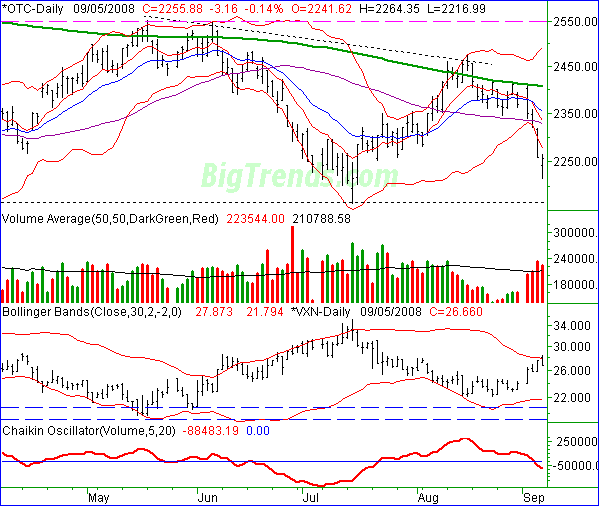
The NASDAQ Composite fell 3.16 points on Friday (-0.14%) to end the day at 2255.88. For the week, that meant a 4.72% loss (-111.64 points). From a momentum perspective that's bearish. However, it's almost a case where things were so bad, they can't get any worse next week. Dead cat bounce anyone?
The wrench in the works was the sharp close under the lower Bollinger band (20-day) on Thursday. Had the composite just traced it lower like we saw in June, this downtrend might be able to persist for a while. Instead, we blew right under it on Thursday and then made another bearish gap at the open on Friday.
Then late in the day on Friday, we saw the NASDAQ almost make a complete recovery, putting the entire sell-off into question. Our bottom line take is that we're on hold. To try and make a guess at this point is nothing more than a coin toss. On the other hand, we do know what to look for come next week.
That support at 2170 is still in play. We only need to fall about 80 more points to retest it. If that happens and we even make the slightest stall there, we're going to be strong net buyers. On the other hand, if the bulls keep at it early next week, and we see a move back inside that lower Bollinger band, that will still only mean tepid bullishness. The real hurdle is still at 2350, and slightly above there - the 200-day moving average line at 2400.
As far as volume is concerned, technically we got a bearish Chaikin line cross under zero. However, given the situation, we're not going to interpret that at face value just yet.
NASDAQ Composite Chart - Daily

S&P 500
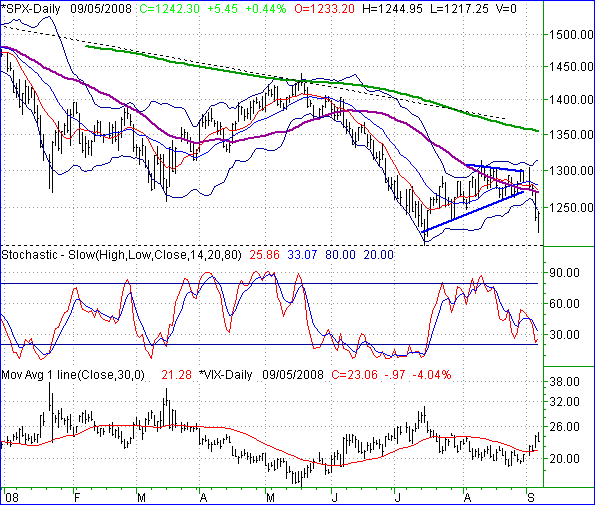
The S&P 500 turned lemons into lemonade on Friday, ending up with a gain of 5.45 points (+ 0.44%). But still, it wasn't enough to offset a pretty dismal week though. The large cap index lost 40.55 points (-3.16%) to close out at 1242.30.
Like the NASDAQ, we could go either way for the SPX. All the support lines we were watching were indeed broken. This includes the 50-day moving average line, and the support line that extends back to July's low (blue). However, the speed and strength of the pullback doesn't leave a whole lot of room for anything else except a dead cat bounce, at least in the short run.
The real clue may lie in the VIX again. It turned lower on Friday after racing to a new multi week high on Thursday. It's still too soon to call that a reversal though. It's clearly not at levels linked to major bottoms, though may not get that high during a September lull.
So, as with the NASDAQ, we can only wait and see how this thing plays out in the coming week. Here's what we're looking for. Support is at 1200 -- July's low. Resistance is around 1275, where all the entangled moving average lines are. A move above them would be bullish, but only until the 200-day moving average line was encountered again at 1350. If for some reason the SPX falls under 1200, we would have to view that as bearish.
S&P 500 Chart - Daily

Dow Jones Industrial Average
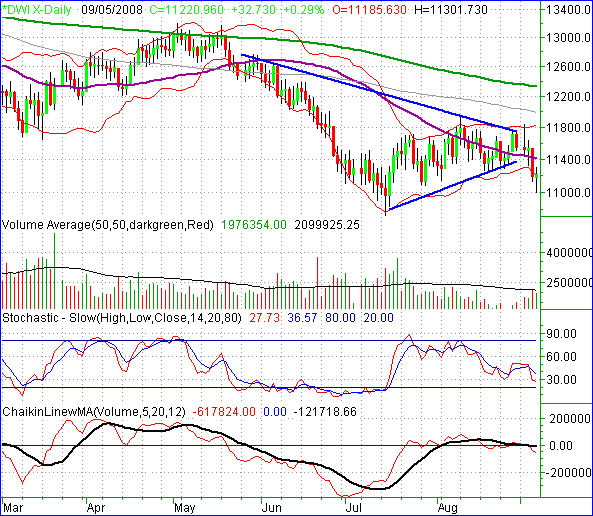
The Dow swung back into the black as well on Friday, gaining 0.29% (+ 32.73 points) to end the week at 11220.96. On a weekly basis, that still translated into a loss of 2.8% (-323 points).
From a purely technical perspective, we have to view this as a bearish chart. That's not to say we're actually pulling the trigger on any more bearish trades though. As with the other two indices, the jury's still out here.
There's one thing that should alarm the bulls about the Dow's chart. There really wasn't a lot of bullish volume behind Friday's rebound.
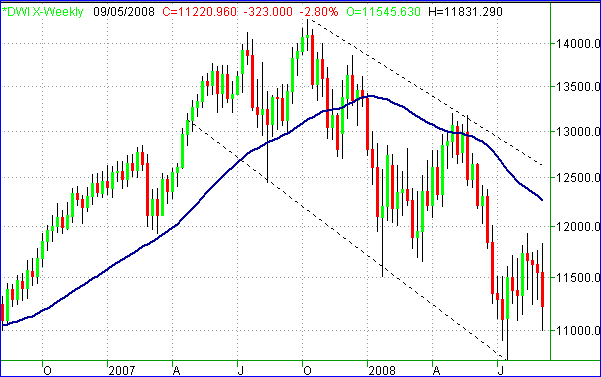
So, we're on the fence here too. Take a look at the daily chart, but then we have some thoughts on the weekly chart as well.
Dow Jones Industrial Average Chart - Daily

Now, about this weekly chart, all we wanted to do is to show it to you Draw your own conclusions, but basically, what we see is still a pretty clear downtrend. Even if the Dow rebounds nicely, it'll still be in a downtrend. The dark blue moving average line is a 200-day moving average line, and clearly it also is a trouble spot.
Point being, even a rally out of this mess isn't exactly a sign of the next bull market. Just be sure to keep your trades distinguished from your investments.
Dow Jones Industrial Average Chart - Weekly

Price Headley is the founder and chief analyst of BigTrends.com.
|