Finding profitable trades presents constant challenge to both novice and experienced traders. As such we would like to welcome you to weekly chart analysis where charts are analyzed in detail, looking at both upside and downside scenarios.
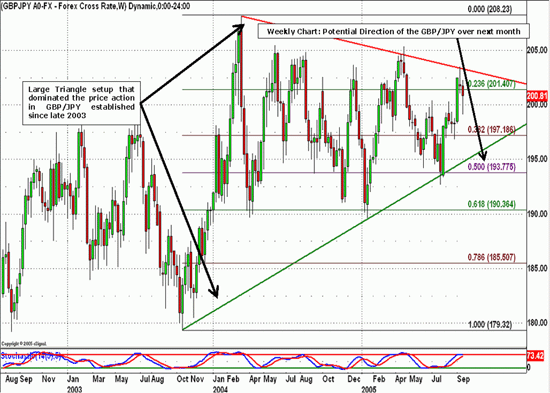
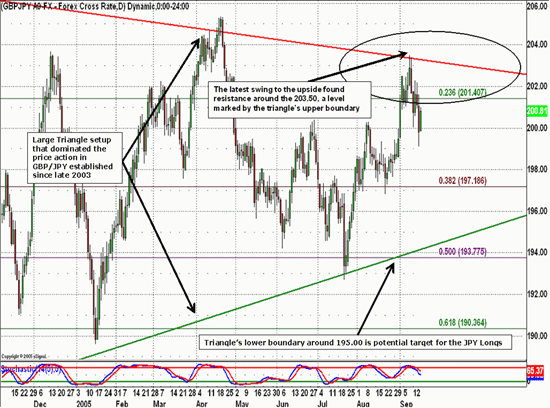
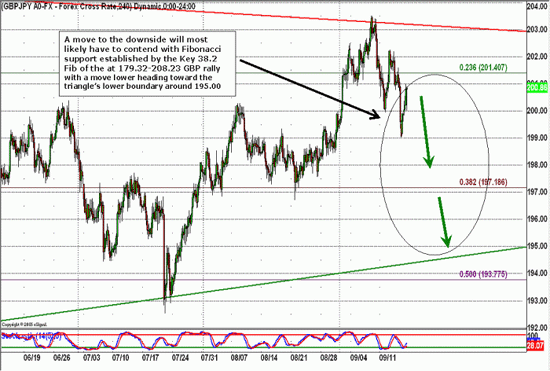
- GBP/JPY continues to swing within a shrinking trading range.
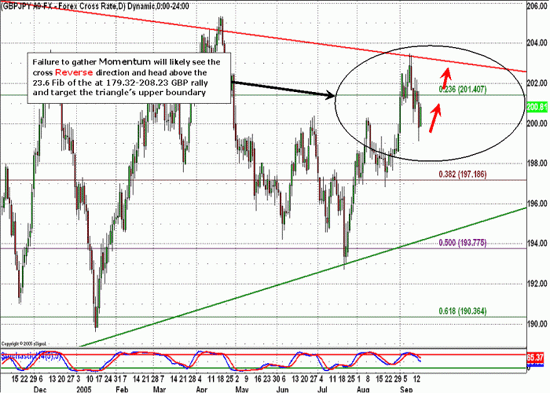
- Failure analysis points to a possible reversal and a move toward the upper boundary.
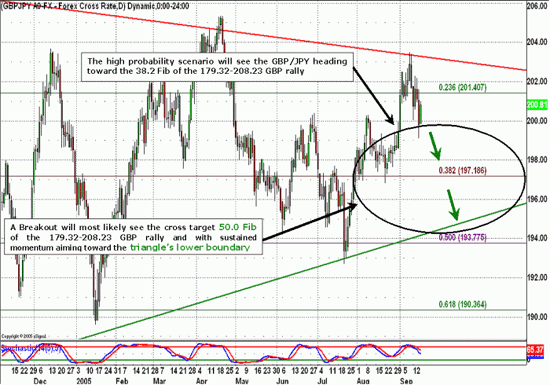
- High probability setup points to move toward triangle's lower boundary.
Key Levels - Current Price: 208.33
Level Type Significance
203.50 Resistance Triangle's upper boundary
201.40 Resistance 23.6 Fib of the 179.32-208.23 GBP rally
197.19 Support 38.2 Fib of the 179.32-208.23 GBP rally
195.00 Support Triangle's lower boundary
193.77 Support 50.0 Fib of the 179.32-208.23 GBP rally
Weekly Chart 09-16-05
Daily Chart I 09-16-05
Daily Chart II 09-16-05
Daily Chart III 09-16-05
4 Hour Chart 09-16-05
Sam Shenker is a Technical Currency Analyst for FXCM.