| Outlook On The Stock Indices |
| By Price Headley |
Published
08/23/2008
|
Stocks
|
Unrated
|
|
|
|
Outlook On The Stock Indices
NASDAQ Composite
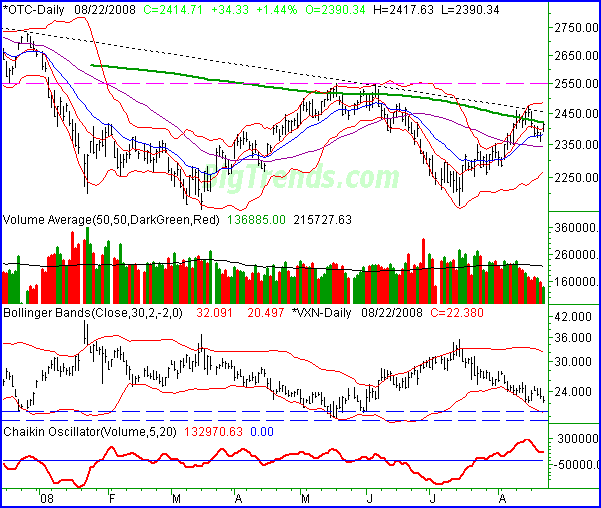
The NASDAQ composite rallied nicely on Friday, gaining 34.33 points (+1.44%) to end the day at 2414.71. For the week, the index still lost 37.81 points (-1.54%). So, don't get too excited just yet.
The bulls could argue that the close above the 10-day moving average line (red) is bullish, and it is. On the other hand, the bears could argue the fact that the composite didn't make it back over the 200-day moving average line (green), which means the bigger trend is still to the downside. As for our take, we're still leaning on the bearish side of the fence.
Take a look at the dark dashed line on the graph. That's a long-term resistance line, actually encountered about a week ago. Whether we get back above the 200-day moving average line now or not, we'll still have to contend with that. Even beyond that, we're still dealing with resistance at 2550, where the index topped in May and June.
With all that being said, the VXN still has some more room to fall before it finds a floor. It closed at 22.38 on Friday, but the 20/21 area has been more apt to be support. This gives the VXN a little more room to sink, which by default would give the NASDAQ a little more room to rise. That rise could carry the index to 2550, but we suspect that falling resistance line will step in before that happens.
NASDAQ Composite Chart - Daily

S&P 500
The gain of 14.5 points (+1.13%) left the S&P 500 at 1292.2. On a weekly basis, that translates into a loss of 6.0 points (-0.46%). However, the S&P 500 did end up getting back into bullish mode by Friday afternoon.
What's bullish? The cross back above the 50-day moving average line. We saw the S&P 500 trade above that line for a few days a couple weeks ago, but fall back under it this week. In fact, we saw the index fall under a key short term support line on Tuesday too. By Friday, however, it was back above both.
The reason we don't want to get too excited yet is just because the index is still dealing with a short term resistance line (also in blue). If the index can get above that line, then we'll have to be at least mildly bullish.
As for how far that bullishness might take the S&P 500, we have to think the longer term resistance line around 1360 (pink) is the likely stopping point. That's also about where the 200-day moving average line (green) is right now.
Still, we have to wonder if Friday was a fake out. Volume was weak, so the issue may have been not an abundance of buyers but rather a lack of sellers. If we happen to see the index fall back under the 10-, 20-, and 50-day moving average lines, that would be pretty decidedly bearish.
S&P 500 Chart - Daily

Dow Jones Industrials
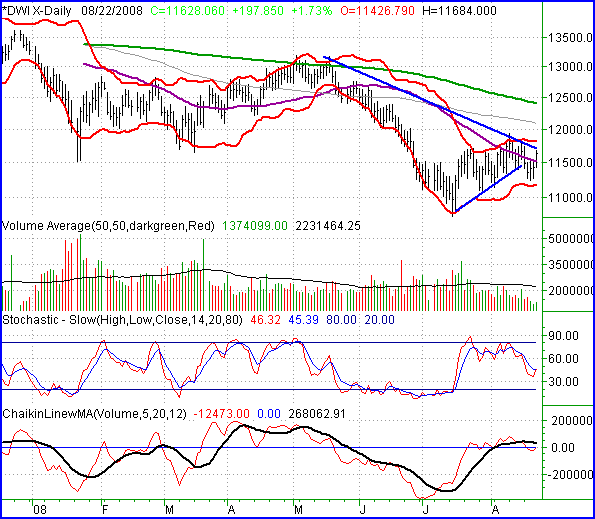
The Dow Jones Industrial Average also closed in the black for Friday, gaining 11,628.06 points (+1.73%). For the week though, it still sank by 31.84 points (-0.27%). Like the S&P 500, the Dow technically finished the week in bullish territory.
What's bullish here? The Dow's cross back above its 50-day moving average line. But, it's still too soon to make that the core of any bullish stance. The red flag of the matter is again just a severe lack of bullish volume.
The bottom line for the Dow is this. We can in infer nothing right now. However, we're keeping a close eye on the Chaikin line (red) and it's moving average (black). If it falls back under zero then we'll know the volume trend is indeed bearish. Until then, it's just guesswork.
Dow Jones Industrials Chart - Daily

Price Headley is the founder and chief analyst of BigTrends.com.
|