| Has Gold Bottomed Out? |
| By Price Headley |
Published
08/22/2008
|
Futures , Stocks
|
Unrated
|
|
|
|
Has Gold Bottomed Out?
The recent decline in gold prices has been very sharp and severe. In fact, gold has not been in any kind of bullish mode since March 2008, underperforming crude oil since that time. We've seen a short-term bounce in gold, but where do we go from here? I've been writing and mentioning recently that I thought gold should outperform vis-a-vis crude oil as its underperformance converges to the norm, but the recent technical damage on GLD has been very severe, and there may be other factors weighing down this commodity.
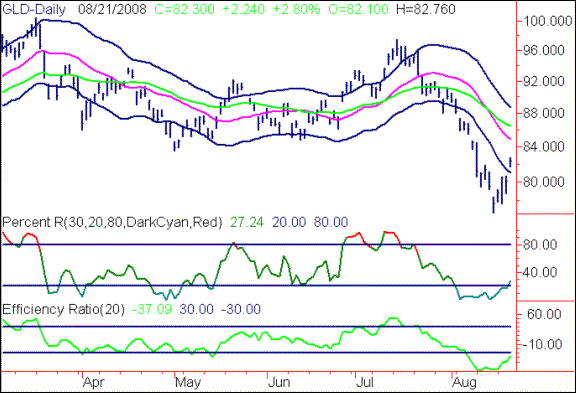
I'm using the SPDR Gold Shares ETF (GLD) as a proxy for gold in this article. If you examine the following GLD Daily Chart, you can see that GLD was so far over-extended below its Bottom Acceleration Band in recent days that a short-term bounce was extremely likely. This short-term bounce seemed overdue, due to the severe nature of the recent selloff. While this bounce back above the Bottom Band was predictable and overdue, it looks like any further rally attempts will be contained around the 86ish area by the Middle Band and 40-Day Exponential Moving Average. Percent R and Efficiency Ratio readings are very weak, as well.
GLD Daily Chart

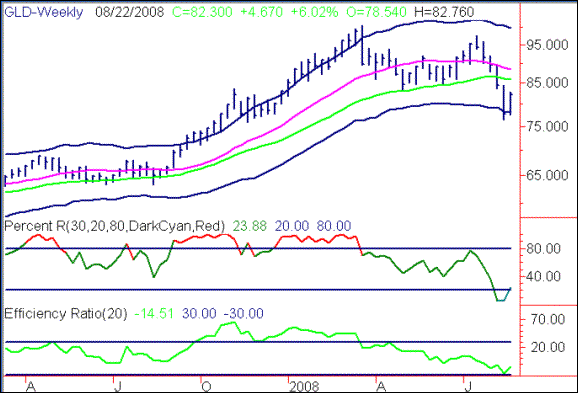
The GLD Weekly Chart below confirms to me the severe nature of this breakdown. We have bounced on a weekly basis from a test of the Bottom Acceleration Band, but face strong overhead resistance up to the 90ish area from the Middle Band and 40 Week Exponential Moving Average. I see this as a chart where we remain in the "bottom half of the bands" for some time - meaning range-bound between 75ish and 90ish.
GLD Weekly Chart

The bottom line is that while my "gut" has been telling me that gold is due to rally, especially in terms of performance versus crude oil. The charts are telling something different. "Don't fight the market" and "the tape tells all" are two market axioms that I am listening to here, outweighing my trading instinct/experience in this case. In addition, there may be bigger macro factors such as the dollar, the world economy and more weighing on the gold prices that are exerting a bigger influence than I anticipated.
Price Headley is the founder and chief analyst of BigTrends.com.
|