Technical Overview
- Euro makes a small advance
- British pound collapse temporarily stalls
- Swiss Franc halts around 1.2600
Market Outlook
Currently the market is going through a consolidation phase that is very healthy if the dollar bulls expect any further gains. A move after the consolidation period should be a staring point for a trend that will most likely see the dollar recover levels not seen since 2004.
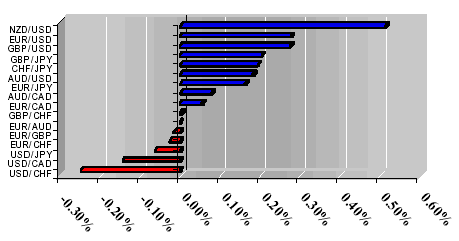
1-Day Currency Pair Relative Strength
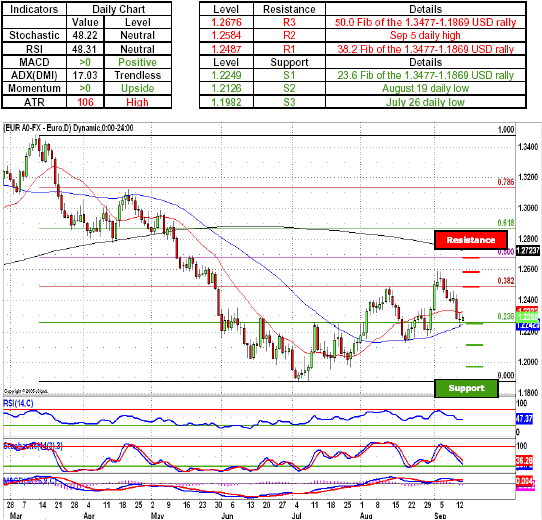
EUR/USD - Euro bulls managed to temporarily halt the advance of the dollar longs as the price action stalled below the 1.2300 figure. As the pair retraces a small percentage of the gains made by greenback during the past few sessions, next move below the 1.2300 figure will most likely see the euro breaking below the channel's lower boundary and head straight for the 1.2249, a level marked by the 23.6 Fib of the 1.3477-1.1869 USD rally. As further advance by the dollar bulls will most likely see the pair test the euro bids around 1.2126, a level protected by the August 19 daily low, with sustained momentum seeing the greenback longs advance toward the psychologically important 1.2000 figure. Indicators continue to favor euro with momentum indicator and MACD both above the zero line, while Stochastic and RSI both tread below overbought thus adding to possibility of a pullback.
Key Levels & Technical Indicators
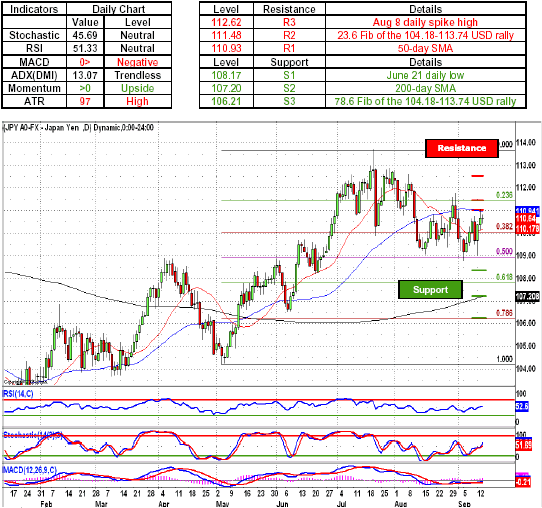
USD/JPY - Japanese Yen longs paused their retreat after giving up the psychologically important 110.00 figure to the dollar bulls, with the pair remaining well bid above the 110.30 line. As greenback longs consolidate their gains and push the pair above the 111.00 handle, which is currently defended by the, a 50-day SMA at 110.93, their next move to the upside will most likely see the pair advance toward 111.48, a level marked by the 23.6 Fib of the 104.18-113.74 USD rally. A sustained momentum of the greenback advance will most likely see the fall of 112.62, a defensive position established by the August 8 daily spike high and a gateway to the 2005 high at 113.68. A break above the 113.68 will most likely open the psychologically important 115.00 handle as a potential target as a break above that will most likely see a long term trend heading toward the 120.00 figure. Indicators are beginning to diverge, with momentum indicator above the zero line and MACD sloping upward toward the zero line, while neutral oscillators give greenback bulls enough room to maneuver.
Key Levels & Technical Indicators
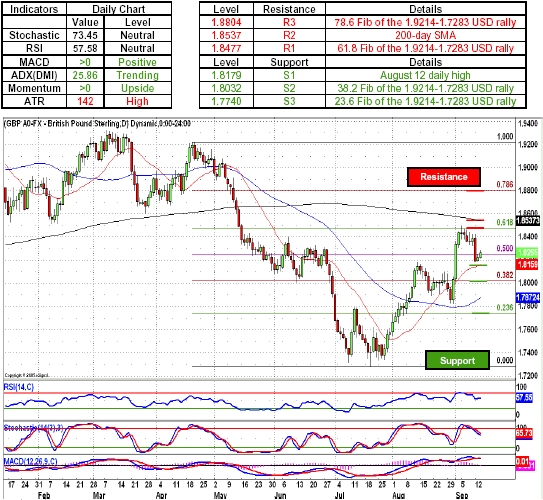
GBP/USD - British pound bulls received a welcome break from a constant pounding by the greenback longs with the pair finding temporary bids around 1.8200 handle. As the price action pauses before the dollar resumes its advance, a move by the cable longs toward the 1.8300 figure will be met by enthusiasm from the greenback longs, as the move by the pound will provide the dollar bulls an additional opportunity to offer out more sterling. A continuation of the original move to the downside will most likely see the dollar longs make their way below the 1.8200 and push toward 1.8179, a level marked by the August 12 daily high, which is further reinforced by the 20-day SMA. A further unwinding of cable's defenses will most likely see the greenback bulls take on the pound bids around 1.8032, a level marked by the 38.2 Fib of the 1.9214-1.7283 USD rally, which currently protects the psychologically important 1.8000 figure. Indicators are signaling weakening trend conditions as ADX declined to 25.86, while both MACD and momentum indicator above the zero line and both oscillators treading below the overbought line.
Key Levels & Technical Indicators
USD/CHF - Swiss Franc longs continued to put up a losing fight as the pair climbed above the 1.2600 figure after Swissie longs failed to push below the 1.2570 bids. As the price action remains on the side of the strong, a next move by the dollar longs will most likely see the pair head toward 1.2705, a level marked by the 23.6 Fib of the 1.1492-1.3085 USD rally. A further collapse of the Swiss Franc defenses will most likely see the pair head toward 1.2786, an August 24 daily high and a gateway toward the psychologically important 1.3000 figure, which is currently defended by 1.2922, a July 29 daily high. Indicators continue to favor Swissie longs with both momentum indicator and MACD below the zero line, while neutral oscillators give either side enough room to maneuver.
Key Levels & Technical Indicators

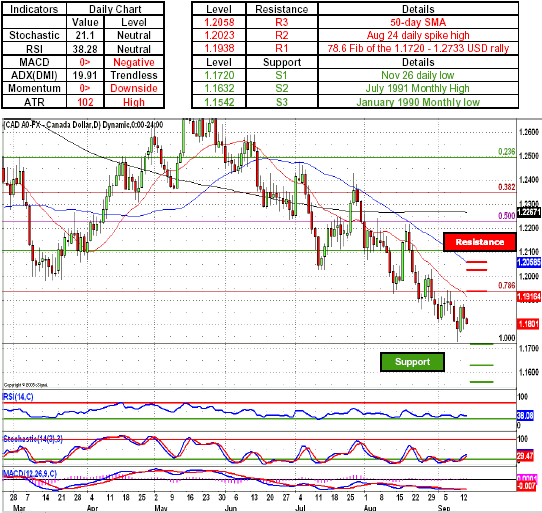
USD/CAD - Canadian dollar bulls remained opposed to their US dollar counterparts with neither side giving up a single pip as the price action continued to orbit the 1.1800 figure. As both sides gear up for an upcoming clash, a move to the upside will most likely see the Loonie longs retreat toward the 1.1900 figure, with a break to the upside testing the CAD defenses at 1.1935, a 78.6 Fib of the 1.1720-1.2733 USD rally, which is further reinforced by the 20-day SMA. Retaliation on the part of Loonie longs will most likely see the greenback retreat toward the 1.1720, a low made by the Canadian dollar bulls during the November of 2004. Until either of theses levels become breached, this analyst advises to stay out of the volatile and directionless price action. Indicators are beginning to favor greenback traders with Stochastic and RSI climbing above the oversold level, while MACD and momentum indicator below the zero line continue to support the Loonie traders.
Key Levels & Technical Indicators
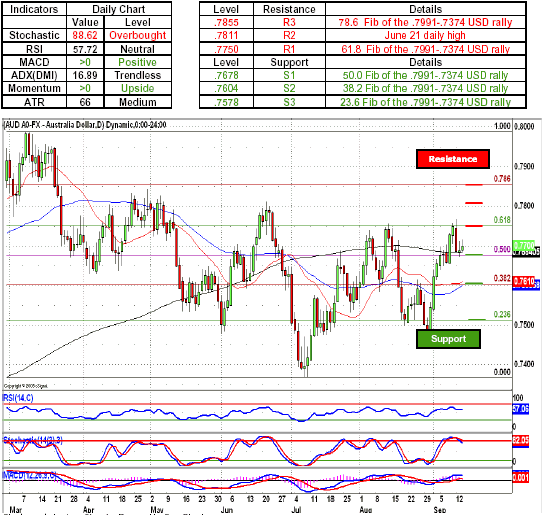
AUD/USD - Australian dollar longs proved to be more resilient than expected as the pair continued to gravitate toward the .7700 level. A failure by the Aussie longs to gain momentum will most likely see the pair head toward the .7678, a level established by the 50.0 Fib of the of the .7991-.7374 USD rally, which is further reinforced by the 200-day SMA. A further collapse of Aussie defenses will most likely see the US dollar bulls push the Australian dollar longs toward the .7604, a 38.2 Fib of the .7991-.7374 USD rally a level that is further reinforced by the 20-day SMA. A further advance by the US dollar longs will most likely see the Aussie head toward the psychologically important .7500 handle. Indicators signal a move to the downside with Stochastic treading above the overbought line, while positive MACD and momentum indicators continuing to favor Aussie longs.
Key Levels & Technical Indicators
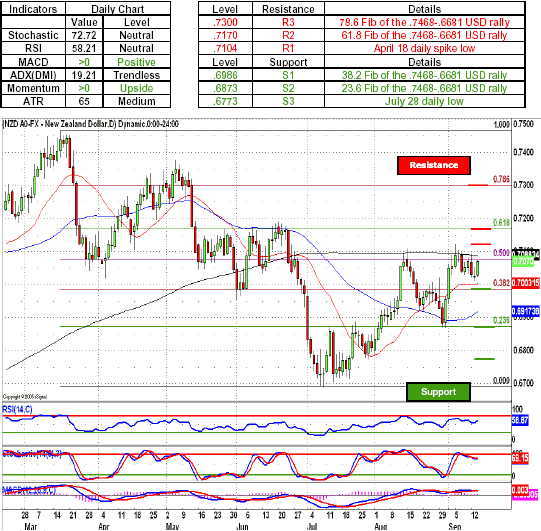
NZD/USD - New Zealand dollar bulls tried to rebel against the US dollar invaders and pushed the pair toward the .7070 line only to be shut down once again and headed lower once again. A sustained break of the psychologically important .7000 handle, will most likely see the greenback bulls take on the Kiwi's defenses at .6986, marked by the key 38.2 Fib of the .7468-.6681 USD rally. A sustained momentum on the part of the US dollar longs will most likely see the pair head toward the .6873, a 23.6 Fib of the .7468-.6681 USD rally. Indicators remain supportive of the New Zealand dollar bulls, with both MACD and momentum indicator above the zero line, while Stochastic dipping back below the overbought line adds to the outlook that Kiwi has reached the end of its travel above .7000 territory.
Key Levels & Technical Indicators
Sam Shenker is a Technical Currency Analyst for FXCM.