| Double Top And Bottom Reversal Patterns |
| By Andy Swan |
Published
07/14/2008
|
Currency , Futures , Options , Stocks
|
Unrated
|
|
|
|
Double Top And Bottom Reversal Patterns
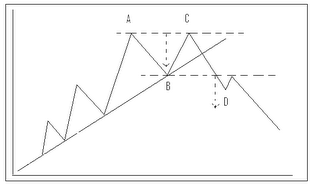
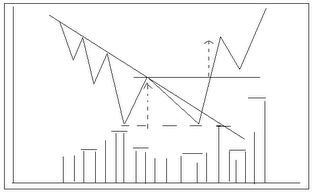
A double top or double bottom is one of the more common reversal patterns. The double top or bottom, second only to the head and shoulders pattern, is the most frequently seen and easily recognized pattern. In the graphs below, you can see why the double top is referred to as an "M" and the bottom as a "W". The characteristics, volume pattern, and measuring rules are similar to that of the head and shoulders and the triple top and bottom, except for there being only two peaks.
Double Top Pattern
Double Bottom Pattern
In our graph of an uptrend showing the double top, we see the market set a new high at point A, usually on decreased volume, and then drop to point B on declining volume. However, the next rally at point C is unable to penetrate the previous peak (A) and begins to fall back again. At this point, we have a potential double top because for the pattern to be completed the previous point at B must be violated on a closing basis. If this fails to happen, we would only have a sideways consolidation phase in an uptrend.
Ideally, the double top would have two peaks at about the same price level with volume being heavier on the first peak and lighter on the second. A decisive close under the middle valley (point B) completes the pattern. This signals a a reversal of trend to the downside. It's not unusual to see a return move to the breakout point prior to resuming the downtrend.
The double bottom is a mirror image of the double top with volume being more important on the upside breakout. it's very common to see a return move back to the breakout point in double bottoms.
Like the head and shoulders and triple tops and bottoms, the measuring technique is again based on the height of the pattern. The measurement is projected from the breakdown point where the middle valley (point B) is broken. An alternative in a double top is to measure the first downleg (point A to B) and project that length downward from point B. In a double bottom, it's the same only in an upward direction.
Andy Swan is co-founder and head trader for DaytradeTeam.com. To get all of Andy's day trading, swing trading, and options trading alerts in real time, subscribe to a one-week, all-inclusive trial membership to DaytradeTeam by clicking here.
|


 Free Festival of Traders Videos