Technical Overview
- Euro gives up 1.2400
- British pound defenses crumble
- Yen fails to break 109.00
Market Outlook
After few weeks of broad based dollar sell-off and last weeks distribution, majors are beginning to cave in as more traders came back after the summer vacation and took the gift of an overextended price action. As dollar bulls pile back into the market, a next move to the downside might turnout to be more than a retrace, a trend is in the Autumn air, a dollar dominated trend, with Commodity block majors on the list for a long departure.
1-Day Currency Pair Relative Strength
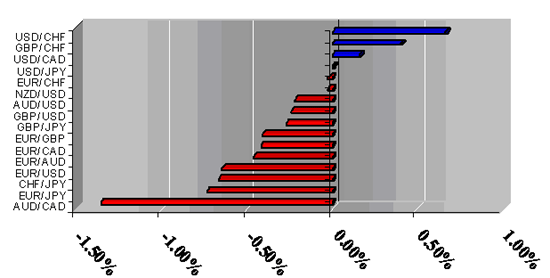
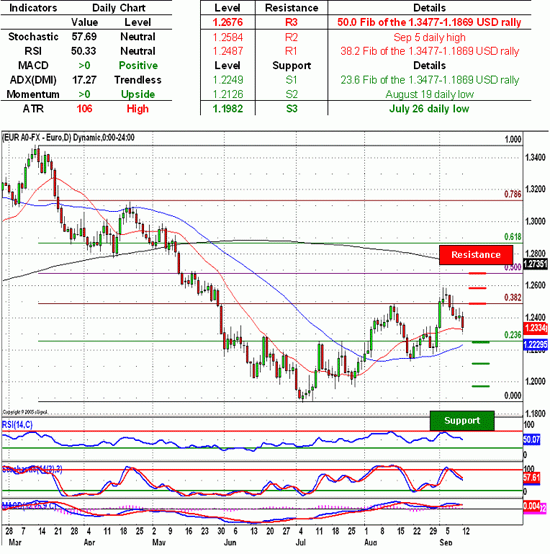
EUR/USD - Euro bulls were in full retreat after the greenback longs sprang into action and wasted no time in pushing the pair below the 1.2400 figure as the dollar longs continued to reestablish their dominance. As the price action remains on the side of the greenback traders, a sustained move to the downside will most likely see the dollar longs continue their assault and take on the single currency defenses around 1.2249, a level marked by the 23.6 Fib of the 1.3477-1.1869 USD rally. A move toward the 1.2250 also should be a decisive for the greenback bulls as it would signal a continuation to the downside due to the break below the trendline that dominated the price action since middle of July. A break of the initial euro defenses will most likely see the greenback follow-through with the momentum and take on the 1.2126, a level protected by the August 19 daily low. Indicators continue to favor euro with momentum indicator and MACD both above the zero line, while Stochastic and RSI both tread below overbought thus adding to possibility of a pullback.
Key Levels & Technical Indicators
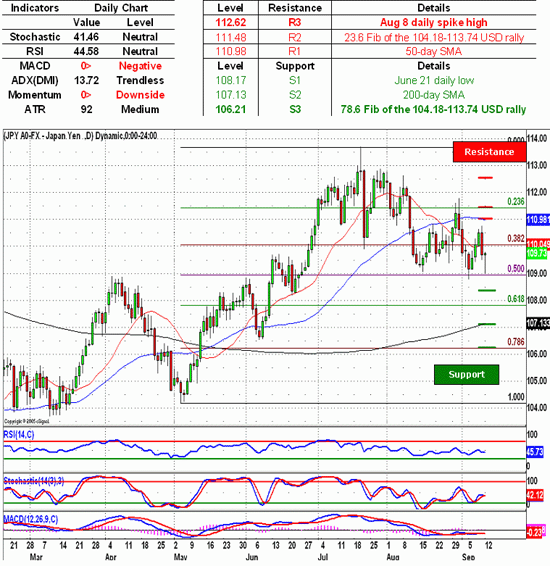
USD/JPY - Japanese Yen longs went on a full out assault and succeed in pushing the greenback longs toward the 109.00 figure, only to walk into a trap set by the dollar bulls. As greenback longs sprang the trap on the unsuspecting yen longs and pushed the pair toward the psychologically important 110.00 handle, a further move to the upside will most likely see the pair head toward 110.98, a 50-day SMA, with further collapse of yen defenses seeing the dollar bulls taking over the 23.6 Fib of the 104.18-113.74 USD rally at 111.48. A sustained momentum of the greenback advance will most likely see the fall of 112.62, a yen defensive position established by the August 8 daily spike high and a gateway to the 2005 high at 113.68. Indicators support the yen longs with both momentum indicator and MACD below the zero line, while both oscillators remain neutral thus giving dollar bulls additional room to maneuver.
Key Levels & Technical Indicators
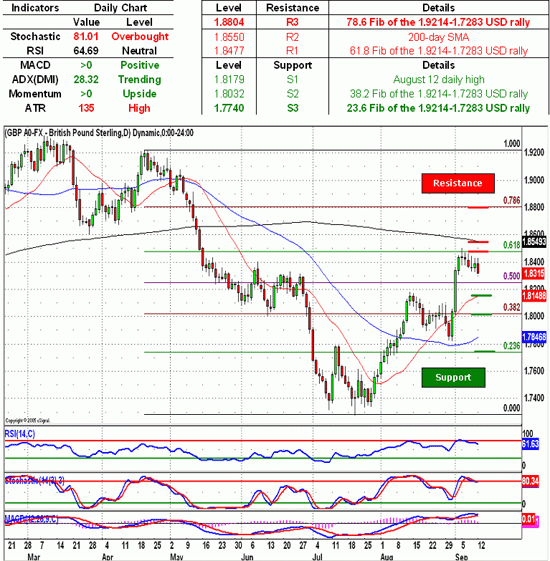
GBP/USD - British pound bulls lived up to their name as the pair was pounded into submission by the dollar bulls as they forced cable longs to unwind their positions above the 1.8300 handle. As sterling longs continue to retreat, a sustained momentum by the dollar longs will most likely see the pair head toward the 1.8251, a level marked by the 50.0 Fib of the 1.9219-1.2784 USD rally, breaking of which will most likely open the next round of pound defenses at 1.8179, a level marked by the August 12 daily high, which is currently reinforced by the 20-day SMA. Indicators are signaling trending conditions with both MACD and momentum indicator above the zero line, while Stochastic is treading above the overbought line, and ADX is above key 25 mark, crossing of which signals an existence of a trend, not a direction.
Key Levels & Technical Indicators
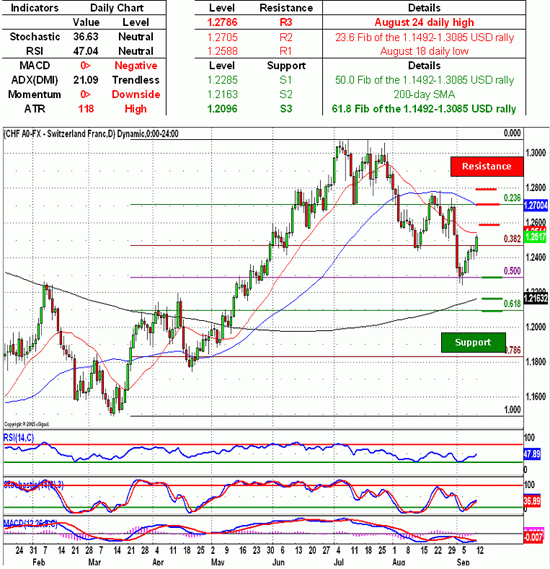
USD/CHF - Swiss Franc longs once again failed to maintain neutrality as greenback bulls went on a rampage and showed the pair back above the psychologically important 1.2500 figure. As Swissie bulls give up more ground to the advancing dollar longs, a sustained break above 1.2500 will most likely see the greenback bulls head higher and test the Swiss Franc defenses around 1.2544, a 20-day SMA. A break above that will most likely see the pair head toward the Swissie offers around 1.2588, an August 18 daily low, with a break above seeing the dollar bulls make their way toward 1.2705, a level marked by the 23.6 Fib of the 1.1492-1.3085 USD rally. Indicators continue to favor Swissie longs with both momentum indicator and MACD below the zero line, while neutral oscillators give either side enough room to maneuver.
Key Levels & Technical Indicators
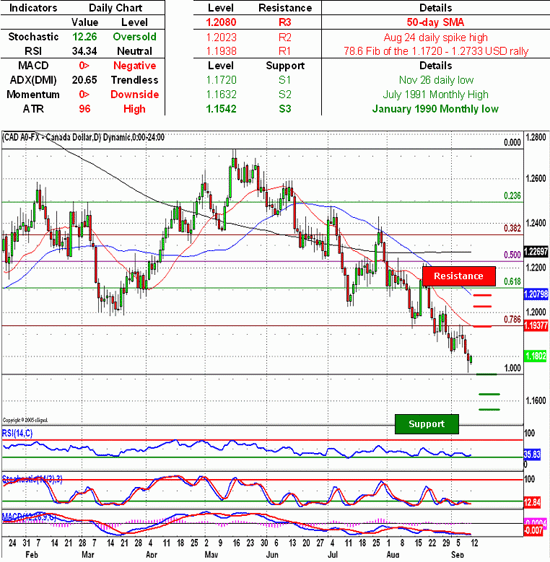
USD/CAD - Canadian dollar bulls were in full retreat after they failed to break toward the 1.1720, a multi-year low set in November of 2004 during the broad anti-dollar rally. As the price action switches favorites and sides with the US dollar, prospective greenback longs will most likely see Loonie longs once more test their luck and push the pair below the 1.1800, however the change is in the air and a move above the 1.1800 will most likely see the pair head toward the 1.1935, a 78.6 Fib of the 1.1720-1.2733 USD rally, which is further reinforced by the 20-day SMA. As US dollar longs remain on a war path, a psychologically important 1.2000 handle remains a key target, as it currently acts as a gateway toward the 1.2106, a 61.8 Fib of the 1.1720-1.2733 USD rally. Indicators are beginning to favor greenback traders with Stochastic slipping below the oversold line, while MACD and momentum indicator below the zero line continue to support the Loonie traders.
Key Levels & Technical Indicators
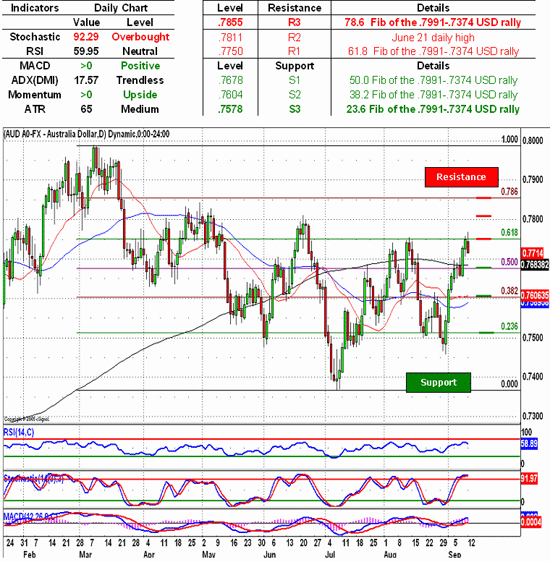
AUD/USD - Australian dollar longs remained in disbelief as everything around them began crumbling like a house of card after the pair failed to breach the greenback defenses above the .7750 line, which is marked by the key 61.8 Fib of the .7991-.7374 USD rally. A retreat from these highs will most likely see the pair tumble toward the .7678, a level established by the 50.0 Fib of the of the .7991-.7374 USD rally, which is further reinforced by the 200-day SMA, with a break of Aussie defenses seeing the US dollar continue to retake its previously lost territory and take the fight to the .7604, a 38.2 Fib of the .7991-.7374 USD rally that is further reinforced by the 20-day SMA. A further advance by the US dollar longs will most likely see the Aussie head toward the psychologically important .7500 handle. Indicators signal a move to the downside with Stochastic treading above the overbought line, while positive MACD and momentum indicators continuing to favor Aussie longs.
Key Levels & Technical Indicators
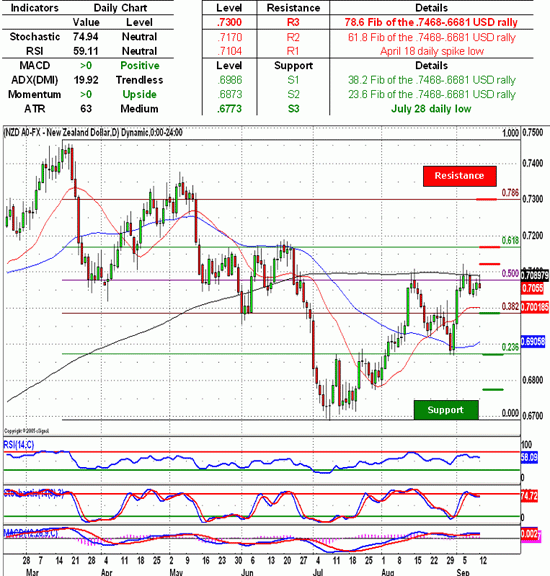
NZD/USD - New Zealand dollar bulls decided to put up one last fight as the pair continued to hover above the .7050 line, waiting for the inevitable collapse. As greenback longs get ready to push the Kiwi of its pedestal and take the pair below the psychologically important .7000 figure, a break of the New Zealand dollar defenses at.6986, a key 38.2 Fib of the .7468-.6681 USD rally will most likely see the greenback bulls crash their way toward the .6873, a 23.6 Fib of the .7468-.6681 USD rally. Indicators remain supportive of the New Zealand dollar bulls, with both MACD and momentum indicator above the zero line, while Stochastic dipping back below the overbought line adds to the outlook that Kiwi has reached the end of its north bound flight.
Key Levels & Technical Indicators
Sam Shenker is a Technical Currency Analyst for FXCM.