- CAD/JPY
- CHF/JPY
- NZD/JPY
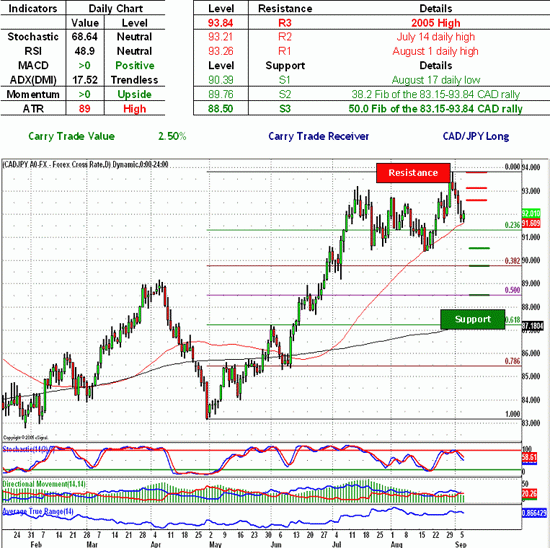
CAD/JPY - Canadian dollar bulls continued to engage the Japanese yen bids following the inability by the yen bulls to pus the cross below 92.00 figure, as the level remains well defended by the 50-day SMA. As CADJPY remains confined in a trading range marked by the 90.50 and the 2005 high at 93.84, the next move by the yen longs will most likely see the cross head toward the 90.39, range lower boundary an Loonie defensive position marked by the August 17 daily low. A break below will most likely see the cross head below the psychologically important 90.00 handle and test the Canadian dollar defenses around 89.76, a 38.2 Fib of the 83.15-93.84 CAD rally. Indicators remain in favor of the Canadian dollar traders with both MACD and momentum indicator above the zero line, while neutral oscillators give either side enough room to maneuver. A note of caution for perspective CADJPY traders trying to trade potential breakout to the upside, ATR is high, signaling high volatility which is adding to the outlook that the cross has topped out.
Key Levels, Technical Indicators & Carry Trade
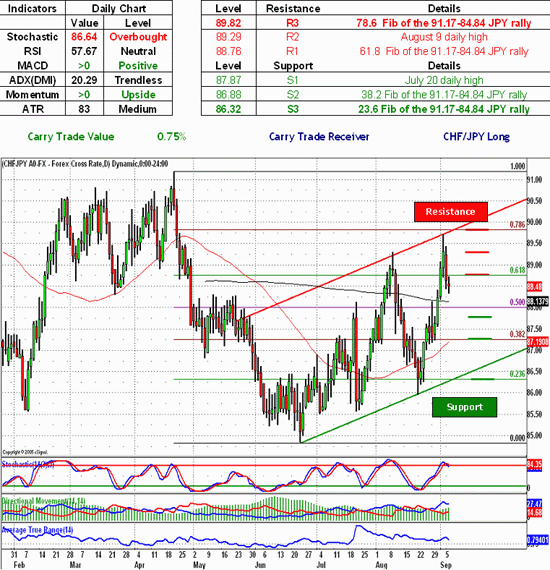
CHF/JPY - Swiss Franc longs took a brief trip above the 88.00 figure, but failed to sustain momentum as the cross fell short of testing the psychologically important 90.00 handle. As the cross remain confined to an upward sloping channel, a break in the Swissie defenses will most likely see the Japanese yen longs try to reassert their dominance and push the cross toward the 87.87, a Swiss Franc defensive position comprised of July 20 daily high. A further move toward the channel's lower boundary will most likely see the CHFJPY test the Swissie defenses around 86.88, a 38.2 Fib of the 91.17-84.84 of the JPY rally. Indicators are mixed as both the momentum indicator and MACD are above the zero line, while oversold Stochastic favors a pullback in the price.
Key Levels, Technical Indicators & Carry Trade
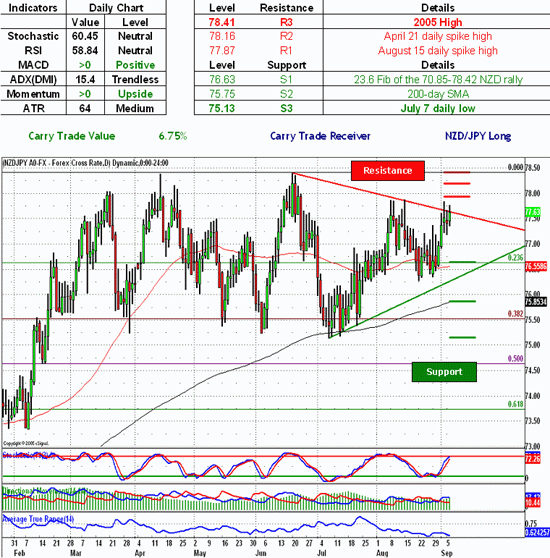
NZD/JPY - New Zealand dollar bulls continued to test the patience of their Japanese yen counterparts as the cross continued to consolidate within a triangle. As the trading rage begins to shrink, a breakdown of the triangle will most likely see the NZDJPY head lower and test the Kiwi's bids around 76.63, a level marked by the 23.6Fib of the 70.85-78.42 NZD rally. A further break in the New Zealand dollar defenses will most likely see the cross tumble toward 75.75, a 200-day SMA, which currently defends the 75.13, a July 7 daily low and a gateway toward the psychologically important 75.00 handle. Indicators remain in favor of New Zealand dollar longs with both MACD and momentum indicator remaining above the zero line, while neutral oscillators are beginning to approach overbought territory, thus raising a cautionary flag.
Key Levels, Technical Indicators & Carry Trade
Sam Shenker is a Technical Currency Analyst for FXCM.


 Free Festival of Traders Videos