| Energy Complex Peaking? |
| By Mike Paulenoff |
Published
11/9/2007
|
Stocks
|
Unrated
|
|
|
|
Energy Complex Peaking?
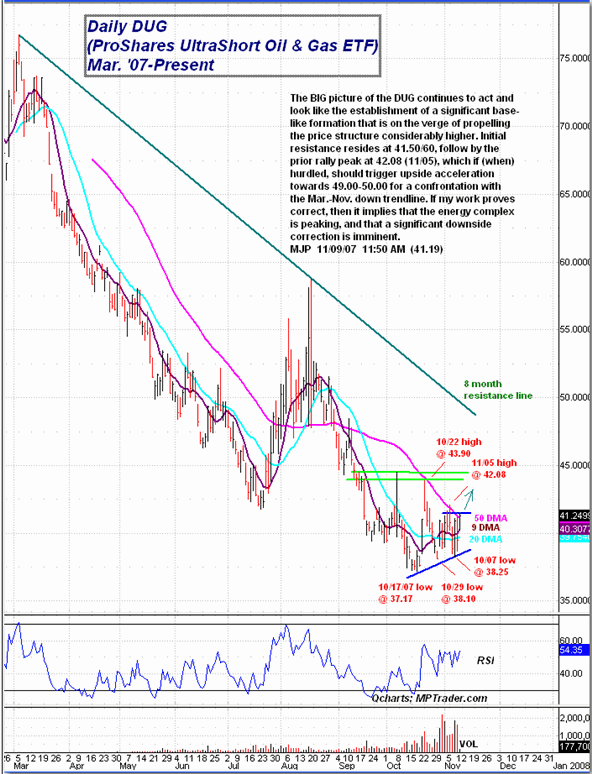
The big picture of the ProShares UltraShort Oil & Gas ETF (DUG) continues to act and look like the establishment of a significant base-like formation that is on the verge of propelling the price structure considerably higher. Initial resistance resides at 41.50/60, followed by the prior rally peak at 42.08 (11/05), which if (when) hurdled, should trigger upside acceleration towards 49.00-50.00 for a confrontation with the March-November down trendline. If my work proves correct, then it implies that the energy complex is peaking and that a significant downside correction is imminent.

Mike Paulenoff is a 26-year veteran of the financial markets and author of MPTrader.com, a real-time diary of his technical chart analysis and trading alerts on all major markets. For more of Mike Paulenoff, sign up for a free 15-Day trial to his MPTrader Diary by clicking here.
|