| S&P 500 Violates 1-Year Moving Average |
| By Mike Paulenoff |
Published
11/8/2007
|
Stocks
|
Unrated
|
|
|
|
S&P 500 Violates 1-Year Moving Average
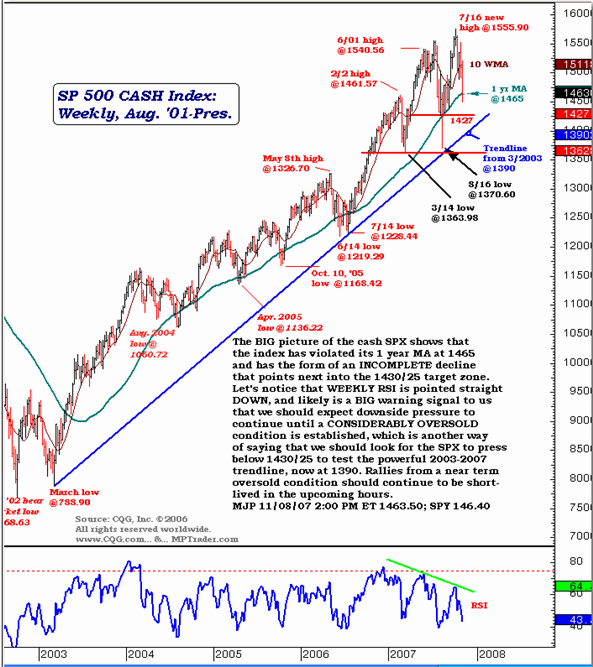
The big picture of the cash SPX shows that the index has violated its 1-year moving average at 1465 and has the form of an incomplete decline that points next into the 1430/25 target zone. Let's notice that the weekly RSI is pointed straight down and likely is a big warning signal to us that we should expect downside pressure to continue until a considerably oversold condition is established, which is another way of saying that we should look for the SPX to press below 1430/25 to test the powerful 2003-2007 trendline, now at 1390. Rallies from a near-term oversold condition should continue to be short-lived in the upcoming hours.

Mike Paulenoff is a 26-year veteran of the financial markets and author of MPTrader.com, a real-time diary of his technical chart analysis and trading alerts on all major markets. For more of Mike Paulenoff, sign up for a free 15-Day trial to his MPTrader Diary by clicking here.
|