| Crude Oil Nearing Major Peak |
| By Mike Paulenoff |
Published
10/29/2007
|
Futures , Stocks
|
Unrated
|
|
|
|
Crude Oil Nearing Major Peak
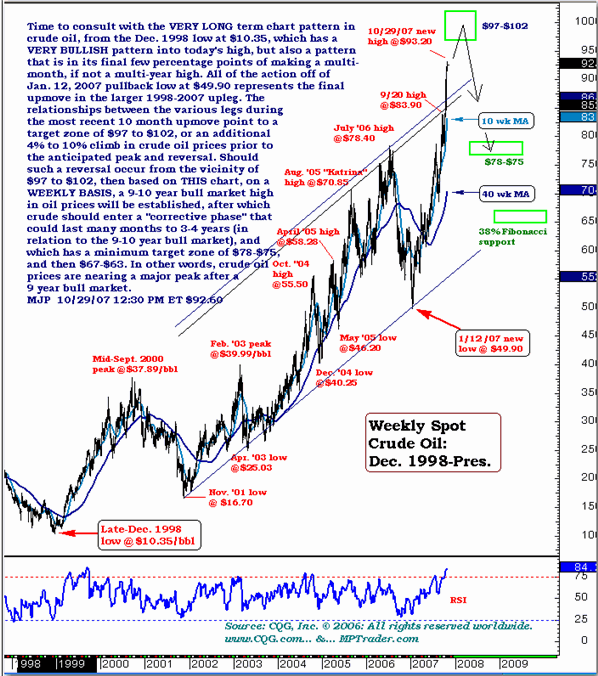
Time to consult with the very long-term chart pattern in crude oil, from the December, 1998 low at $10.35, which has a very bullish pattern, into today's high, also a pattern that is in its final few percentage points of making a multi-month, if not a multi-year, high. All of the action off of the January 12, 2007 pullback low at $49.90 represents the final upmove in the larger 1998-2007 upleg. The relationships between the various legs during the most recent 10-month upmove point to a target zone of $97 to $102, or an additional 4%-10% climb in crude oil prices prior to the anticipated peak and reversal. Should such a reversal occur from the vicinity of $97 to $102, then based on this chart, on a weekly basis, a 9-10 year bull market high in oil prices will be established, after which crude should enter a "corrective phase" that could last many months to 3-4 years (in relation to the 9-10 year bull market), and which has a minimum target zone of $78-$75, and then $67-$63. In other words, crude oil prices are nearing a major peak after a 9-year bull market.
Mike Paulenoff is a 26-year veteran of the financial markets and author of MPTrader.com, a real-time diary of his technical chart analysis and trading alerts on all major markets. For more of Mike Paulenoff, sign up for a free 15-Day trial to his MPTrader Diary by clicking here.
|


 Free Festival of Traders Videos