|
As the Subprime Turns
"As the World Turns" is a popular soap opera playing on American TV. It focuses, as do most soaps, on the lives and foibles of its characters, with plenty of dramatic flair. We are watching a different type of soap opera today which we could call "As the Subprime Turns". And the world is watching. It has plenty of drama, lots of flawed characters, a plot that is hard to understand, everyone saying it was the other guy's fault and the world (literally) paying for the sins of exuberance in the US.
In this week's letter we look at the housing market, its affect on consumer spending, take a glance at oil and see if we can figure out why the stock market is so excited.
But first, let me re-visit last week's letter where I talked about the $80 billion Super SIV fund that is being created by Citigroup, Bank of American and JP Morgan Chase. A lot of commentators have been writing about what a bad idea it is, and a few have taken me to task. They think it is a bad idea to rescue bad investments. They want the market to clean out the bad stuff so we can start functioning again.
And I agree, but that is not what the fund is going to do, as I understand it. The Super SIV fund is simply offering to buy only the good assets in failed SIVs. In essence, they (and the US Treasury) are worried that there will be a rush to the exits from failing SIVs (mostly in Europe) that will result in a panic forcing down the prices of good assets far below where they should be. That could seriously affect the capital structure of US banks and create a severe credit crunch. This fund simply sets a floor for the price of good assets at $.94 cents in cash and a 4% note.
They are not going to take the subprime junk. That is going to have to be written off by whoever owns it. This does not seem like a bail-out to me, but self-interested parties in a free market whose interest is in avoiding a panic and also will allow a mark to market price for assets. I think it makes sense. If I am wrong and any of the toxic subprime assets show up in the Super SIV, then I would agree that it is a very bad idea indeed.
"The Market for New Homes is Dead"
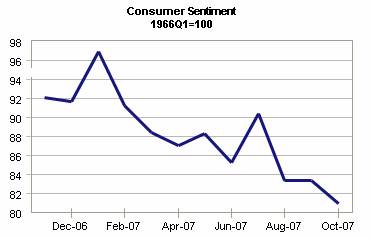
Consumer sentiment continued its 17-month decline, dropping in the University of Michigan poll to under 81. And the consumer has a reason to be bummed out. He is watching the price of food and energy rise and home prices fall.
Existing home sales fell to an annualized rate of 5 million while the number of homes for sale rose to a 10.5 month supply. Sales are down 19% from a year ago, but much of that drop is in the last few months, as there was an 8% drop in just the last month, as loans (see more below) keep getting harder to find. If you are trying to sell a condominium, it is even worse. There is a 12.6 months supply of condos.
But we also found out yesterday that median prices for homes that sold were down by 5%. It is the first real sign that homeowners were willing to sell for less. Typically home owners don't want to sell for less than the best price they have recently heard for their home. And as they resist lowering their price, the inventory goes up.
And that is the national number. There are markets in Florida where the supply of homes for sale is in the 36-month range. And we are adding more homes every day through foreclosures.
But wait. We find out that new home sales rose by 4.8%. Inventories are down modestly to 8.3 months of supply, but up from the 3.5 months of supply we saw this time last year. Have we seen the bottom? Depends on how you look at the data.
New home sales for September came in at 770,000. Last month they told us August sales were 795,000. So how did they figure an almost 5% rise? Well, it seems they had to revise August sales down by 60,000 as August was really only 735,000. And there is a pattern here. June was revised down by 38,000. July was revised down by 69,000. Cancellations are running at 30%. Anyone care to wager that September numbers won't be revised down below August? And then we will find out that home sales did in fact drop.
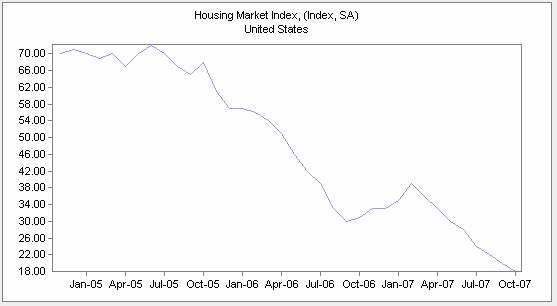
If there was such a reckless person, it probably wouldn't be someone from the housing industry. The National Association of Home Builders released their latest survey. This is not a happy group. The index is at its lowest point ever (see chart below). Homebuilder optimism is down. Traffic (people looking to buy a new home) is at its lowest level ever.
As Economy.com says this week, "The market for new homes is dead for all practical purposes. Eighteen is the lowest rating in the history of the index. The seasonally adjusted numbers are also the lowest on record for October for every subcategory, as they have been for each month since spring began. The bottom of this market will not be reached until there is another significant decline in the cost to prospective buyers, both in house prices and mortgage rates."
Why are things so bad? In part, because the home mortgage industry is reeling. It is very difficult to get a non-conforming loan. The subprime mortgage market is comatose, as any mortgage bank which makes a loan today has to expect to keep it on their books. Lending standards are then appropriately tight. There is simply no securitization of subprime loans to speak of, down from $600 billion last year.
And for good reason. As is now known to everyone, investing in subprime asset-backed securities had been a bad bet. An index which tracks Residential Mortgage Backed Securities shows that the BBB- index for RMBS is down to $.18 cents on the dollar. And this was for mortgages in a security that was sold earlier this year. Being down 82% in less than a year is not what you expect from an investment grade bond.
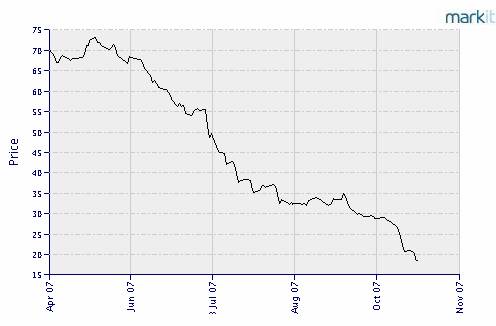
The AAA portion of the same bonds are down by 16% and the AA is down by an astounding 48% with the A rated paper down by 71%. Again, that is for an index of 20 RMBS that was put together and sold this year. Ugly.
Mortgage Pig of the Year
And a great illustration of how really bad it is was written by Allan Sloan (senior editor-at-large for Fortune) in this week's Fortune. It is simply the best explanation of the current meltdown in the subprime market I have read anywhere.
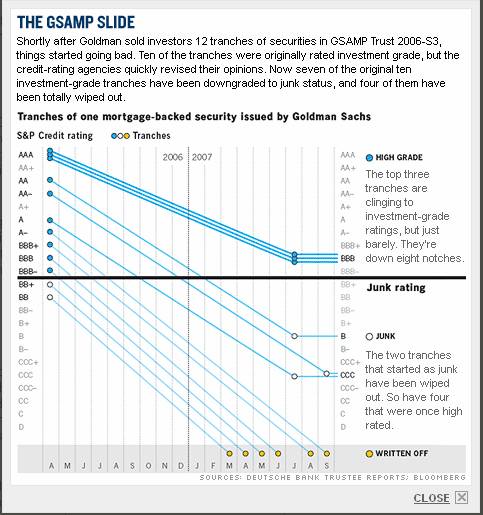
Sloan asked for someone to show him one of the worst of the RMBS. He was directed to one called the Goldman Sachs Alternative Mortgage Products Trust 2006-3. It was a mere $494 million, or about 1% of the $500 billion RMBS's that were issued last year.
It does qualify for pig of the year. It was composed entirely of second lien loans.
But let's go the story and let Sloan tell it. "In the spring of 2006, Goldman assembled 8,274 second-mortgage loans originated by Fremont Investment & Loan, Long Beach Mortgage Co., and assorted other players. More than a third of the loans were in California, then a hot market. It was a run-of-the-mill deal, one of the 916 residential mortgage-backed issues totaling $592 billion that were sold last year.
"The average equity that the second-mortgage borrowers had in their homes was 0.71%. (No, that's not a misprint - the average loan-to-value of the issue's borrowers was 99.29%.)
"It gets even hinkier. Some 58% of the loans were no-documentation or low-documentation. This means that although 98% of the borrowers said they were occupying the homes they were borrowing on - "owner-occupied" loans are considered less risky than loans to speculators - no one knows if that was true. And no one knows whether borrowers' incomes or assets bore any serious relationship to what they told the mortgage lenders.
"You can see why borrowers lined up for the loans, even though they carried high interest rates. If you took out one of these second mortgages and a typical 80% first mortgage, you got to buy a house with essentially none of your own money at risk. If house prices rose, you'd have a profit. If house prices fell and you couldn't make your mortgage payments, you'd get to walk away with nothing (or almost nothing) out of pocket. It was go-go finance, very 21st century."
Now as my long time readers know, these securities are sliced up into different portions called a tranche (which Sloan tells me is French for slice, something I didn't know). Goldman created 13 different tranches with ratings from Moody's and Standard and Poor's starting at AAA and going down to BB (and the last piece or the "equity" tranche is not rated. Six of those tranches have already been completely written off. The AA tranche is now considered junk. Look at the chart below which shows how fast the losses started piling up from a start point just 18 months ago.
And that average loan to value of 1% is under water with home prices down at least 10% in those California and Florida markets and going lower. But it gets worse. You wonder if the people buying this paper actually read the prospectus on what they were buying. Back to Sloan:
"Through the end of 2005, if you couldn't make your mortgage payments, you could generally get out from under by selling the house at a profit or refinancing it. But in 2006 we hit an inflection point. House prices began stagnating or falling in many markets. Instead of HPA - industry shorthand for house-price appreciation - we had HPD: house-price depreciation.
"Interest rates on mortgages stopped falling. Way too late, as usual, regulators and lenders began imposing higher credit standards. If you had borrowed 99%-plus of the purchase price (as the average GSAMP borrower did) and couldn't make your payments, couldn't refinance, and couldn't sell at a profit, it was over. Lights out.
"As a second-mortgage holder, GSAMP couldn't foreclose on deadbeats unless the first-mortgage holder also foreclosed. That's because to foreclose on a second mortgage, you have to repay the first mortgage in full, and there was no money set aside to do that. So if a borrower decided to keep on paying the first mortgage but not the second, the holder of the second would get bagged.
"If the holder of the first mortgage foreclosed, there was likely to be little or nothing left for GSAMP, the second-mortgage holder. Indeed, the monthly reports issued by Deutsche Bank (Charts), the issue's trustee, indicate that GSAMP has recovered almost nothing on its foreclosed loans.
"By February 2007, Moody's and S&P began downgrading the issue. Both agencies dropped the top-rated tranches all the way to BBB from their original AAA, depressing the securities' market price substantially.
In March, less than a year after the issue was sold, GSAMP began defaulting on its obligations. By the end of September, 18% of the loans had defaulted, according to Deutsche Bank.
"As a result, the X tranche, both B tranches, and the four bottom M tranches have been wiped out, and M-3 is being chewed up like a frame house with termites. At this point, there's no way to know whether any of the A tranches will ultimately be impaired."
I just touched the surface of this article. It is well worth reading. But it illustrates why no subprime paper is going to be written for some time. There are going to have to be new standards for mortgages that will create the confidence in the probability that an investor will get all the principal and interest due him.
It also means that the weak housing market is going to get worse before we see the bottom. Two million homes will go into foreclosure in the next two years, if home prices continue to slump, said a report released by Joint Economic Committee Chairman Senator Charles Schumer. Home ownership rates are beginning to decline for the first time since 1981.
The ownership rate reached a record 69.3% of households in 2004, up from 64% a decade earlier. With home prices soaring, net household wealth nearly doubled to $51.8 trillion at the end of 2005 from $27.6 trillion in 1995, with real-estate accounting for 47 percent of the change, according to Federal Reserve data.
That growth has boosted consumer confidence and spending. Studies show that consumer spending increases by about $5 for every $100 rise in the value of a consumer's home. But if home values decline, the reverse should happen.
When the Going Gets Rough, Simply Borrow More
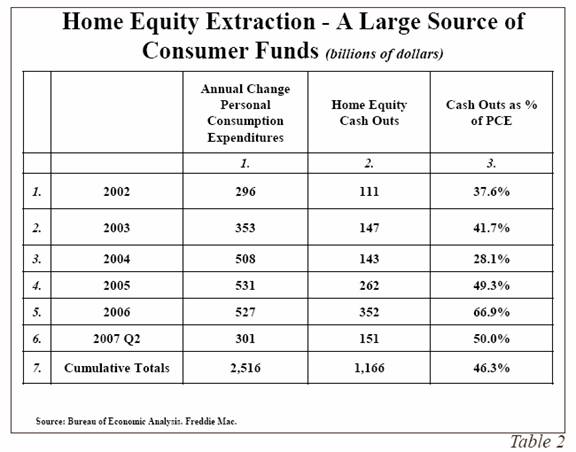
Next week's Outside the Box will be from my friends at Hoisington Investment Management Company. But I have to use one of the tables as it makes a very remarkable point. Most of us (including me) have been under the impression that Home Equity Mortgage Withdrawals have been on the serious decline. But that is not entirely the case as the table below shows.
"First, home equity cash outs, as tabulated by Freddie Mac, totaled $151 billion, or an amount equal to 50% of the rise in total consumer spending (PCE) during the initial two quarters of 2007. Not all of the proceeds of the equity extractions went toward consumer spending, yet the total sum was a substantial source of liquidity for the consumer. More amazing, perhaps, is the fact that over the past 5 1/2 years, $1.1 trillion in equity has been extracted from homes. This represents 46% of the increase in total consumer spending over the same period (Table 2). The tightening of credit standards and declining home prices will virtually guarantee that $1.1 trillion will not be extracted in the next few years. Consequently, slower consumer outlay growth can be expected for an extended period."
$100 Oil and $1,000 Gold
I wrote in August of 2006 that $100 oil would be the solution and not the problem. It will cause people to look for substitute energy sources. However, I did not think we would see $100 oil so soon. I was asking in January of this year, with oil bouncing around the mid-50's (down from a recent $77) whether oil should be $40 or $80? Today, oil hit $92 before selling off a little at the close to $91.86.
Let's go back to the beginning of 2002. Oil was $15.89 a barrel and 17.96 (in euros). Oil has since risen 3.5 times in terms of euros and 5.8 in dollar terms in less than 6 years. The difference clearly shows the depreciation of the dollar.
It is hard to imagine that $90 oil is not going to have some impact on consumers. If you heat your home with oil, and tens of millions do, you are going to be wearing more sweaters in the house or you are going to have a much higher bill this winter.
Between rising costs and a decreasing ability to borrow, the US consumer is finally going to have to retreat a little in the next few quarters.
Gold closed today at $787.50 with the dollar falling to almost $1.44 in euros. That is an interesting cap to the week in which I was at the New Orleans Conference attended mainly by gold bugs. 80% of the exhibitors were natural resource companies of one flavor or another.
As you might imagine, there were a lot of happy investors. And a lot of advisors bearish on the dollar, as I have been for almost six years. But I have to tell you that makes me nervous.
One of my favorite movies of all time is Trading Places. It is Dan Akroyd and Eddie Murphy at their best. But one of the great lines comes from Don Ameche and Ralph Bellamy, who play the two older brothers Randolph and Mortimer Duke, respectively. As the world of orange juice prices go against them, Don Ameche turns to Bellamy and yells, "Sell! Mortimer. Sell!" But there was no one on the other side to buy, and they went bankrupt.
And who can forget the cameo scene in Murphy's Coming to America where he gave a sack of cash to two skid row bums, who turn out to be the Dukes. They leap up shouting "We're back in business!" Such is the mentality of traders.
I think $1.50 against the euro is in the cards. But the dollar could bounce back viciously before that, as everyone everywhere is bearish. There needs to be someone on the other side of the trade. One of the great rules of trading is that when everybody is on the same side of the investing boat, the boat is going to turn over.
That being said, I think there is still time to get in on the fun in gold. In my opinion, gold is a neutral currency. I think gold goes up against most currencies everywhere over the next five years. You can play that with an ETF on gold or by buying gold stocks. I like the stock approach.
I spent some time in New Orleans with old friends Doug Casey and David Galland of Casey Research. They do a lot of research on gold and natural resource stocks and have been on a roll of late. I made my first "ten-bagger" almost 25 years ago on a tip from Doug (where does the time go?). He is still on his game, although with somewhat less hair. But it is ok to lose some hair as long as you do not lose the passion.
John Mauldin is president of Millennium Wave Advisors, LLC, a registered investment advisor. Contact John at John@FrontlineThoughts.com.
Disclaimer
John Mauldin is president of Millennium Wave Advisors, LLC, a registered investment advisor. All material presented herein is believed to be reliable but we cannot attest to its accuracy. Investment recommendations may change and readers are urged to check with their investment counselors before making any investment decisions.
|


 Free Festival of Traders Videos