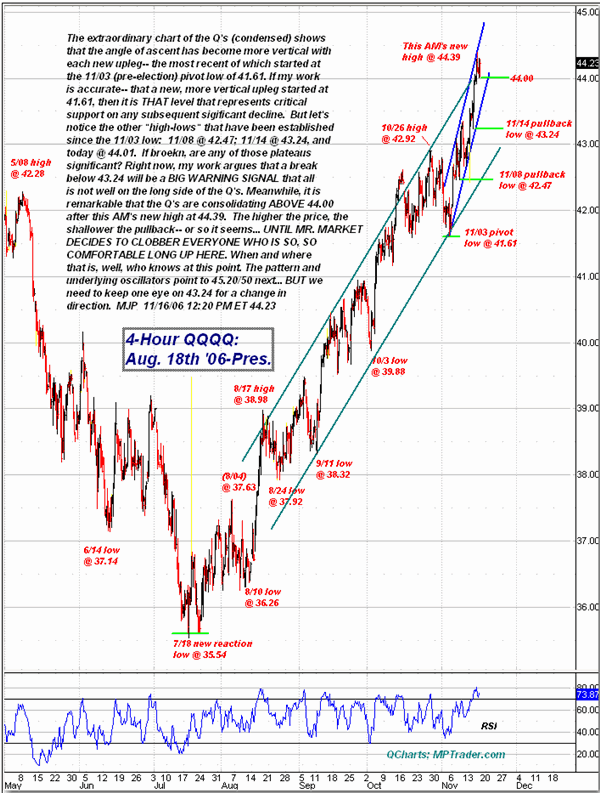
The extraordinary chart of the Q's (condensed) shows that the angle of ascent has become more vertical with each new upleg, the most recent of which started at the November 3 (pre-election) pivot low of 41.61. If my work is accurate -- that a new, more vertical upleg started at 41.61 -- then it is that level that represents critical support on any subsequent sigificant decline.
But let's notice the other "high-lows" that have been established since the November 3 low: 11/08 @ 42.47; 11/14 @ 43.24, and today @ 44.01. If broken, are any of those plateaus significant? Right now, my work argues that a break below 43.24 will be a big warning signal that all is not well on the long side of the Q's.

Mike Paulenoff is a 26-year veteran of the financial markets and author of MPTrader.com, a real-time diary of his technical chart analysis and trading alerts on all major markets. For more of Mike Paulenoff, sign up for a free 15-Day trial to his MPTrader Diary by clicking here.