Navarro’s Big Economic Picture
Well, the markets took at least some succor last Friday when the jobs report came out with a big jump in jobs and a further decline in the unemployment rate. The futures turned green and then all of the major indices finished up for the day, with the Dow leading the way.
What caught my eye last week, however, was something more subtle, namely, how broad-based the slowdown in stock market action has been. As I noted in my daily blog, the IBD Weekend Review didn’t show a single stock ready to break out. That’s a very rare event. And my favorite technical analysis website Market Edge’s list of new daily upgrades shrunk to less than a full page. An equally rare event.
Beneath all of this, there appears to be a coiling action which, sooner or, less likely, later, the market is going to burst out one way or the other. Risk/rewards favors a downward correction, but a short term bounce is only slightly less likely.
In this kind of market, I’m short the market and long “story stocks†– primarily biotech – whose fortunes are going to rise and fall more on the outcome of drug trials than business cycle fluctuations. Cash is not a bad place to be for another week or so until the market better declares itself. Pure long is a pure gamble at this point.
This Week’s Macroeconomic Calendar Market Movers
No rest for the weary this week. Retail sales on Tuesday will be a likely market mover, with sharp eyes looking for any signs of slowdown. Wednesday’s Fed Beige Book is always a good read for the discerning macro geek. On Thursday, the CPI will be of increasing interest as concerns over inflation mount. Look for any sign of weakness in housing starts and building permits as well. The week ends with consumer sentiment and capacity utilization. Will sentiment show signs of unraveling? Will capacity utilitization bump up against inflationary constraints? Discerning market watchers will want to know.
Hedging Your Bets With Matt Davio: Parabolic Destruction
When I step back and look at the last 3 years of the one-way rally we have had in the US and world markets, I am truly amazed that we have not seen a break down of significance (say a 5% to 10% move down). That is not normal. But we are not living in normal times. We are living in a reflationary environment where all asset classes move in concert, propped up by the biggest governments and their easy monetary and fiscal policies.
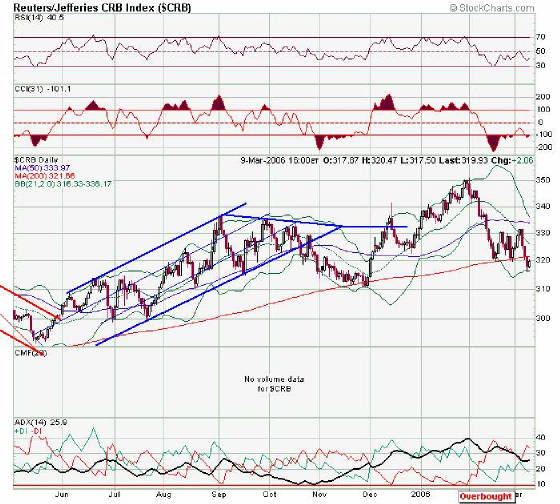
After 5 days down in a row, Friday’s volatility on the traditional VIX again dove down under 12 as the markets rallied hard. And while no real technical damage was done to the markets after those 5 down days, one thing that has started to ease is the CRB (commodity – oil, gold, copper, wheat, etc) index. You can clearly see this in my first chart.
In particular, the commodities, which have been acting like tech stocks over the past 3 years, may finally be hitting the first wall. Overall they have come off their highs about 10% and the daily charts have broken both the 50 and 200 day moving averages.
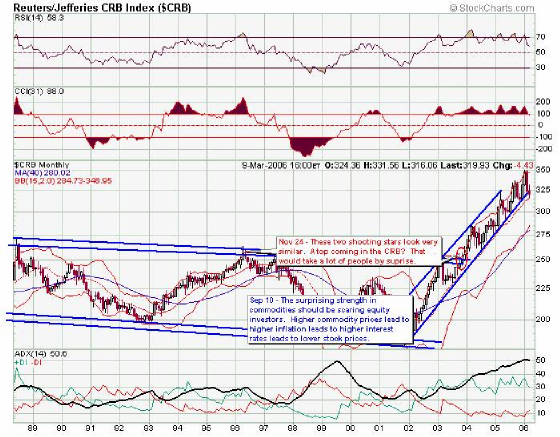
Now if we look closely at the 2nd chart, you will also see the first break of the CRB’s parabolic move just beginning. I really would be concerned about the overall market here, as I am not finding great leadership in other sectors as the CRB begins what could be its first roll over. Without the leadership from the commodities and/or leadership and rotation into other sectors, the big picture starts to look weaker than advertised.
The last chart to look at is the CRB index vs. the 30 year T-bond rate. The first thing to know is that the CRB/30 year ratio is a loose leading indicator of future stock prices. This is due to the fact that when the ratio is high and commodity prices go up and/or interest rates go down, liquidity increases and profit margins dwindle (due to higher commodity costs). As the ratio lowers and commodity prices go down.
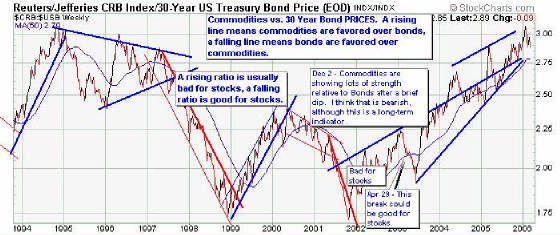
Now as you can see, we have been sitting near the top of the CRB/30 year chart over the past few years, yet the stock markets, bond markets, and the commodities have all risen. If the CRB Index indeed begins a pullback and the CRB/30 year ratio lowers, that should be a signal for a bullish scenario in stocks. But with all asset classes rising without a major correction, and the CRB/30 year ratio still in the 95th percentile of its range, I believe that a true bullish scenario for stocks is a far ways off. Again, we come back to my theory that instrument pricing is indeed different under a reflationary environment. That is, until people realize the risk associated with pandemic price inflation and adjust accordingly.
Peter Navarro is a business professor at the University of California-Irvine, and can be contacted at pn@peternavarro.com. Matt Davio is a managing partner at the hedge fund, Red Rock Capital Fund, and be contacted for hedge fund services at redrock@peternavarro.com.
DISCLAIMER: This newsletter is written for educational purposes only. By no means do any of its contents recommend, advocate or urge the buying, selling, or holding of any financial instrument whatsoever. Trading and investing involves high levels of risk. The authors express personal opinions and will not assume any responsibility whatsoever for the actions of the reader. The authors may or may not have positions in the financial instruments discussed in this newsletter. Future results can be dramatically different from the opinions expressed herein. Past performance does not guarantee future performance.