What's the market outlook for this week?
Another big week for stocks last week -- bigger than the week before last, actually. The market jumped nearly 6.0%, bringing the low-to-high swing to a massive 13.9% in a mere nine days. Is this yet another rally that's ready to peter out (like the last four), or is this swing the end of the consolidation and the beginning of better days?
We'll weigh the good and the bad in a second, but first we want to paint a bigger economic picture.
Economic Calendar
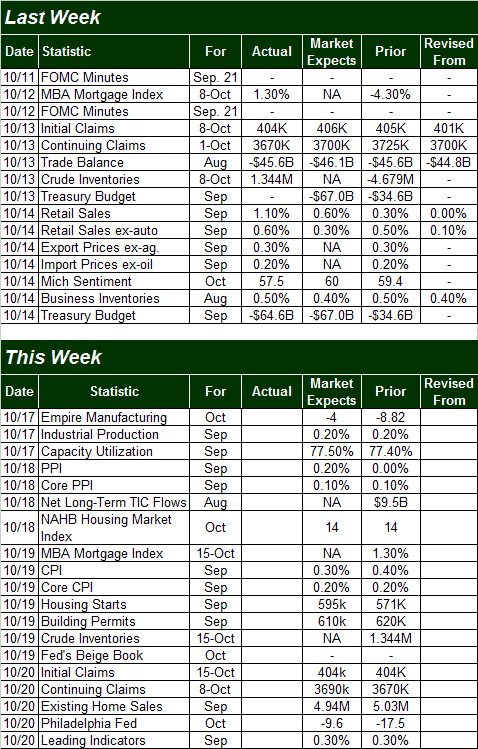
It wasn't an overly busy week last week on the economic front, but we got some fairly important doses of data.
The biggie was retail sales… much better than expected for September. Overall, retail spending was up 1.1% last month with cars, and up 0.6% without cars. Both topped the prior month's growth, and both topped expectations. (And, August's numbers were revised upwards, quite a bit actually.) In fact, retail sales are at or near record-levels reached in 2007, and have grown every month except one this year. Despite the suggestions otherwise, the consumer isn't dead in the water.
Jobs-wise, new unemployment claims held steady just above 400K, while ongoing claims from two weeks ago fell to 3.67 million, from 3.72 million . Neither measure has improved significantly – if at all – for several weeks.
The Michigan Sentiment Index bounced from last month's 55.7 to 57.5 (so far) for October. It will be revised two more times, but still, it's at or near multi-year lows. While the low levels are said to be recessionary, note that most sentiment indicators tend to hit bottom with the market – not hit low levels at the beginning of the recession. (They can linger at low readings as bottoms are being made, but sentiment lulls tend to coincide with market bottoms… not create them.)
Economic Calendar 
The coming week is a little more loaded. The biggies to watch for are:
* Monday: Industrial Production and Capacity Utilization –
We've mentioned this before, but it bears repeating now…capacity usage and productivity have an enormous correlation with the long-term bull/bear market cycle. Both should have grown again last month, even if tepidly, which is keeping economic hopes alive.
* Tuesday: Producer Inflation –
We got a break last month (August) when producer inflation finally was held in check, but the pros are looking for another rise in input prices again.
* Wednesday: Consumer Inflation –
Consumer prices haven't been held in check at all recently, and that's not going to change for September. As of the last look, the inflation rate was 3.77%, and that's not apt to change this time around.
* Wednesday: Housing Starts & Building Permits –
It is what it is. Contrary to popular belief, these numbers are NOT getting worse. They're just not getting better.
* Thursday: Continuing and Initial Unemployment Claims –
More of the same on tap.
* Thursday: Existing home sales –
To round out the starts and permits data; the forecasters are looking for a slight dip to an annual rate of 4.94 million.
Stock Market Outlook
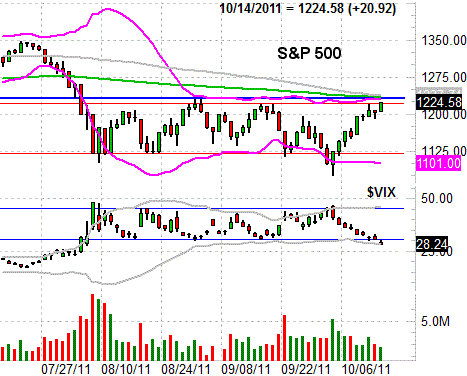
The strong finish on Friday also happened to carry the S&P 500 Index (SPX) (SPY) almost to new multi-week highs. The high of 1224.61 was almost a perfect brush of a very well-established ceiling, but clearly not a break above it.
And therein lies the rub… we've been right here before, and so far to no avail.
Yes, there's a difference this time around – we ran up into this ceiling after a very deep low and as the result of nearly a 14% bounce…. in just nine days. That's pushing the limit of how far and fast the market can run.
To be more direct, the speed of the bounce and the degree to which we're overbought will make any follow-through even more difficult. And even if the 1224 level is cleared, there's a massive confluence of resistance right at 1233 where the upper 20-day Bollinger band is about to intersect with the 100-day and the 200-day moving averages. So, even a little more progress from here won't get the market over the hump.
Worse (for the bulls), there's a stark lack of volume behind the current bullish swing.
But what about the fact that the CBOE Volatility Index (VIX) has finally managed to break under its floor at 30.00 even if the S&P 500 hasn't been able to clear its ceiling? Yeah, that's a consideration. The VIX has yet to really push its lower 20-day Bollinger band any lower though, so it's still too soon to say the VIX is saying we're finally coming out of the right patch.
If it goes lower while the S&P 500 hurdles 1233, then we'll rethink things. For now though – given the pattern that's been in place since August – we still have to assume a pullback is in the cards even though we know October is normally a bear-killer. [We hope we're wrong about the assumption.]
SPX & VIX Daily Chart 
Dow Jones Industrial Average/NASDAQ Composite
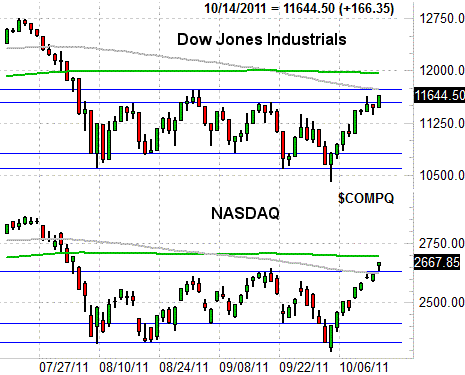
Just for the sake of telling the complete story of this recent bullish swing, we're showing you the Dow (DIA) and NASDAQ charts too.
The Dow Jones Industrial Average hasn't yet made new multi-week highs, but it's now into that 11,540/11,730 zone that's been a make-or-break zone since late August. The NASDAQ is at new highs, which is encouraging in the grand scheme of things even if we see another pullback. The Composite tends to lead the market both up and down, so to see it at least poke its head into new territory is a glimmer of hope that traders are thinking 'just maybe'.
DJIA & NASDAQ Composite Daily Chart 
In neither case has the 200-day moving average line (green) been hurdled, though the NASDAQ has cleared the 100-day moving average line. All three indices really need to clear the major hurdles around the same time to confirm any bullishness.
Sector Performance
For the same reason we don't want to jump the gun on any bullishness, we don't want to jump the gun on any new sector leaders – we still may see a setback. But, we are starting to see some emerging leadership we'll want to keep any eye on going forward.
The biggie is the technology industry (XLK), which was never really a weak performer after the August plunge, but has resumed a clear leadership role as of last week. If the market gets any traction at all in Q4, tech will be a place to be. The materials sector (XLB) is starting to roll again too.
As was said, with the market already stressed, we need to be careful with any sector. On a relative strength basis though, both are now worth focusing on. Stay tuned.
Sector Comparison, since August 8th 
Price Headley is the founder and chief analyst of BigTrends.com.