Navarro’s Market Rap
We’re now one month into my short side call for the market while last week I indicated there might be a technical bounce. So far, so good in the prognostication game – although last week’s mid-week bounce was schizoid. The S&P 500 bounced up and back down while the Nasdaq bounced and then rode Google earnings to end on an up note.
So where do we stand? IBD claims in its Big Picture column that we are big in rally mode. Seems like our otherwise cautious brethren at IBD are getting a bit ahead of themselves.
Barron’s gives us a cover story about the Dow hitting 11,000 but if you actually look at the poll numbers, the picture is much more bearish. Less than a majority were bullish. But what was really interesting was the internal inconsistencies. 60% of participants viewed budget deficits as a threat and 60% also said we wouldn’t raise taxes to balance the budget while 60% said the housing market had reached a bubble stage and the Fed would keep raising interest rates. Not sure how you get a bull market out of that.
Let’s step back for a minute and simply observe that in most years, most of the stock markets’ gains come between now and the end of the year. I don’t see that happening with all the macro swill roiling around – and add another hurricane to the mix of economic disruptions and drains on the U.S. treasury.
Bottom line: The short side still has a better risk-reward ratio, at least for the SPY and DOW.
The Week Ahead: TJIF?
The Big Kahuna this week will be the first look at 3rd quarter GDP on Friday. Anticipation will make for a week in which volume is likely to fall as week’s end approaches.
The housing bubble will get its monthly gut check with existing home sales on Tuesday and new on Thursday.
Peter’s Portfolio: Shorts and Longs
The Google bounce took my doubled up QQQQ position back down into flat territory. Holding fast but will cut quick if a rally threatens. The bubble of air has been released from SVA and watching that to maybe add to a new small position.
I was wrong about ARDI earnings. They come out this week, and I still see NOTHING in its price and volume action to suggest any strong upside surprise. So I have just sat tight.
Holding dogs ARTX and ASTM as options while DSS still sits with strong technicals but has yet to spring from the gate.
Opened a new position in PHMD. It’s an excimer laser play for dermatologist applications. Penny stock with low liquidity by good technicals.
Sure glad my CHIR options are for 2007. It may take that long to get them back above water as that company seems to be snake bit at a time when bird flu rumors should be spinning its cash register.
CPTCQ is inching up and looking to break the two buck mark. Look for some positive news on orders in the near term to goose it.
Hedging Your Bets With Matt Davio: Intradays on the Move
Last week, we had some of the biggest intraday moves we have seen in years. I think this is a further sign of things to come. Usually trend changes are preceded by large scale volatile moves on both sides of the market. However, once again we are back in the conundrum of are we going higher or lower? As traders, this is where we let the game come to us and show us the hand we will be dealt as I don’t have the answer for you dear reader.
On a macro level, 30 year interest rates continue to inch over 6% and inflation numbers continue to confuse and confound most economists out there as the hedonic adjustments the government makes takes out all things inflationary and supplants those with all things deflationary.
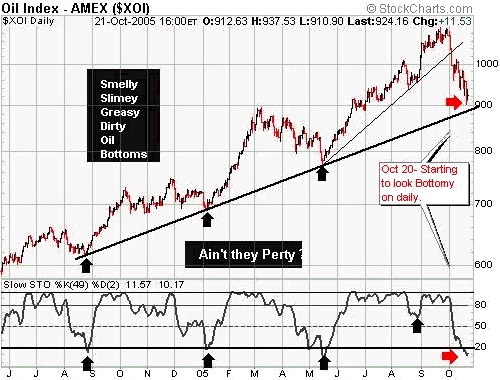
One final thought: Wasn’t it interesting how Oil has come from $70 a barrel all the way under $60 today and still the SPX has met a large decline of 5.5%. Obviously, without energy of late the SPX would have fallen much lower is the answer. I still maintain as long as oil remains above $55 a barrel, the longer term bull is in control with oil. Let’s see how it plays out Jethro. Take a peak at this final chart of the Oil Service Group. I think the chart tells a good story!!

Peter Navarro is a business professor at the University of California-Irvine, and can be contacted at peter@peternavarro.com. Matt Davio is a managing partner at the hedge fund, Red Rock Capital Fund, and be contacted for hedge fund services at redrock@peternavarro.com.
DISCLAIMER: This newsletter is written for educational purposes only. By no means do any of its contents recommend, advocate or urge the buying, selling, or holding of any financial instrument whatsoever. Trading and investing involves high levels of risk. The authors express personal opinions and will not assume any responsibility whatsoever for the actions of the reader. The authors may or may not have positions in the financial instruments discussed in this newsletter. Future results can be dramatically different from the opinions expressed herein. Past performance does not guarantee future performance.