The Biotech HOLDRS Trust (BBH) has emerged as one of the best-performing ETF's.
Let's take a look at some of the top and bottom performing ETF's and ETN's over the past week. Keep in mind that we cull the list to avoid duplicate sectors and we toss out Ultra, UltraShorts, 2X, 3X, and Inverse ETF's. Some of these names are lightly traded and may be fairly illiquid. Make sure that you research the holdings and design of theseETFs before considering any trade. 
The laggards this week include Energy-related Coal and Solar ETFs, and also Countries that are tied to Natural Resources such as Russia and Canada. The Biotech HOLDRS Trust (BBH) emerged in our list of the best-performing ETFs. For those not familiar with BBH, it is an ETF that tracks Biotechnology firms, including industry heavyweights Amgen (AMGN), Biogen Idec (BIIB), Celera (CRA), Genzyme (GENZ), and Gilead Sciences (GILD). To call BBH an ETF is a bit of a misnomer, as the security is actually what is known as a "grantor trust." This designation means that the BBH can't adjust its holdings unless it is a result of a corporate action. This structure could lead some to shy away from the BBH.
You can see in the above table that BBH shows a positive return for every time horizon measured, including both the 3-year and 5-year time horizons. Admittedly these gains are modest, but considering that both the S&P 500 Index and Nasdaq 100 Index are down over a 5-year time frame, it is certainly a market outperformer.
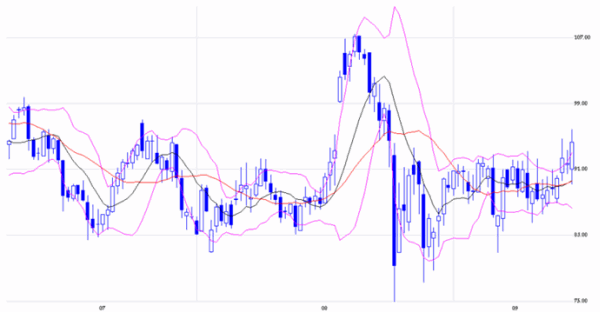
On a technical basis, the weekly chart of BBH below is fairly encouraging. The shares basically bottomed out in late-2008, began recovering before the broad market did, and look to have recently broken above a sideways trading range. In addition, they are penetrating the top Bollinger Band. However, there is potential overhead resistance from levels reached in 2007.
BBH Weekly Chart 
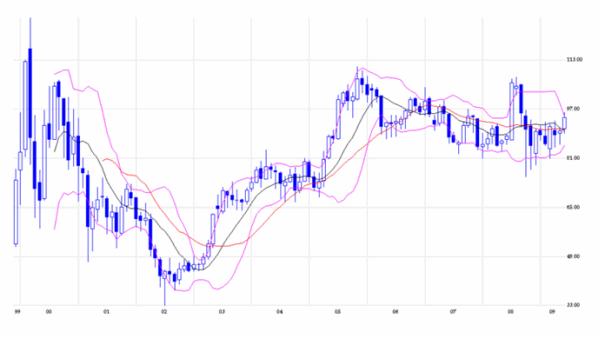
The 10-year monthly chart of BBH below is not quite as positive from the long-term perspective. We basically look to be in a slightly downtrending channel since 2005, and the bottom of this channel and technical support is far below current levels.
BBH Monthly Chart 
Price Headley is the founder and chief analyst of BigTrends.com.