Looking for yet another way to figure out which direction oil may be heading next?
Looking for yet-another way to figure out which direction oil may be heading next? I'm surprised the latest entry into the contest didn't get a little more fanfare. So, I'll do my part.
In July, the CBOE introduced an oil volatility index. Like the S&P 500 VIX or NASDAQ VIX (or all the other VIXes), the data is designed to reflect expectations of volatility over the next few weeks. And, like the other VIXes, I think in reality this will ultimately end up being a fear gauge for oil. That's its potential power as an indicator.
Though officially launched in July, the CBOE was kind enough to back-fill a little more than a year's worth of data...certainly more than enough to get a feel for how it works, or if it works.
Our readers will know we're huge fans of the marketwide, the S&P 500's specifically. It's been a great contrarian tool, and we've used it with much success for many years. That's why it pains me a little to say that as far as crude oil is concerned, the crude oil VIX doesn't appear to have much real value. Why? It doesn't behave consistently or predictably.
On the chart below I've plotted crude oil prices on top, and the crude VIX on the bottom. I've also wrapped the crude VIX in Bollinger bands, hoping to spot an 'extreme' reading at which things would reverse for the commodity. I saw extreme levels at the upper as well as lower bands. However, crude prices seemed mostly unaffected by it.
Crude Oil Vs. Crude Oil Volatility Index 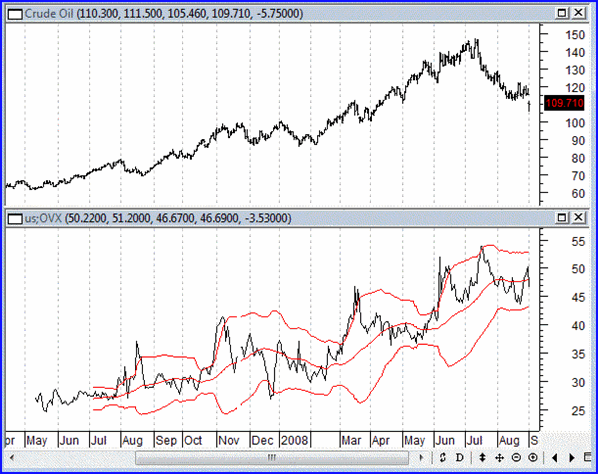
In other words, I don't think the crude oil VIX works in the way we're used to seeing a VIX work. That's not to say it's useless. I'm just saying it's not a great contrarian tool, at least not yet anyway.
That said, I have had some success in forecasting oil prices lately using another tool. It's not the first time I've talked about using Fibonacci retracement levels. I'm an avid fan, though my faith in them isn't blind.
In any case, based on two distinct sets of Fibonacci lines, I think yesterday's big plunge for crude may have full satisfied the retracement required to get started on an upside reversal, even though they are down again today.
Starting with a baseline at 86.20, we plot a Fibonacci span all the way up to the peak of 146.20. The two likely retracement levels are at 123.50, and 109.16. Obviously the 38.2% retarcement of 123.50 is in the past, but the 61.8% retracement to 109.16 is still very much in play. We traded under there briefly yesterday before lcosing a hair above it, and today we're dancing in the area again. (Fibonacci retracement lines aren't an exact science, so I'm not overly worried about not stopping cold at 109.16.) Take a look, then keep reading.
Crude Oil, Fibonacci Lines - Near Term 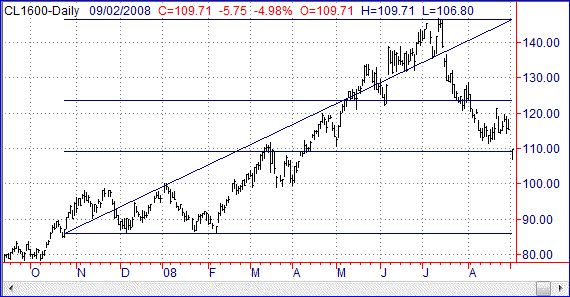
Now let's zoom out to a longer-term weekly chart, and apply Fibonacci lines to crude's bigger rally, from 2007's low of 49.90 to the peak of 146.20. The 61.8% retracement level is at 87.07 -- too far out of view to worry about for right now. However, the 38.2% retracement line is at 109.51.
Crude Oil, Fibonacci Lines - Long Term 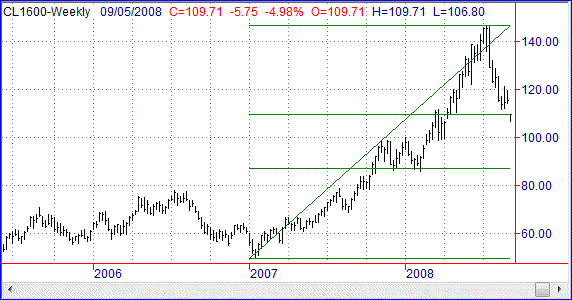
If the number seems familiar, that's basically where the short-term 61.8% retracement line is.
Both retracement lines by themselves are important, but to see them line up one right on top of the other makes the current level a price of major importance, and a key inflection point.
If it breaks down, then crude could really tumble. I think, however, that this congestion of Fibonacci lines will end up acting as support, and send oil upward again. We just had to fall all the way back to those key levels - and a little bit under them - to burn off any organic selling pressure.
That said, don't think for a minute I don't realize this is as much of a dollar-based trade as it is about oil. The U.S. dollar is now at ten month highs, and largely responsible for crude's demise. However, the likely ebb and flow of the dollar can just as easily materialize visually on a chart of crude oil.
That changes nothing though. Even if the dollar continues to rise and send oil lower, any move under 109 is probably just going to be the beginning of a much bigger move lower. Until that's clearly taking shape, Fibonacci lines say to hold up here while oil gets its bearings.
Price Headley is the founder and chief analyst of BigTrends.com.