Professional trader Price Headley analyzes the Dow, S&P, and Nasdaq stocks indices.
NASDAQ Composite
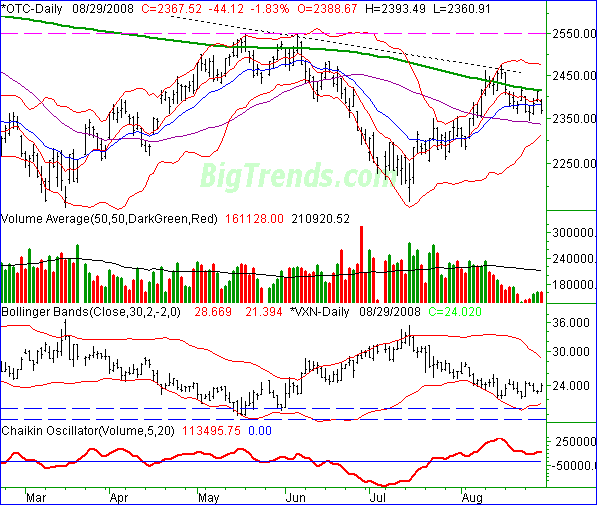
The NASDAQ composite fell a whopping 44.12 points on Friday (-1.83%) to end the day at 2367.52. For the week that meant a loss of 47.19 points (-1.95%). More importantly, the chart turned pretty decisively bearish -- more so for the NASDAQ than any other index.
The heart of the problem was that 200-day line, as we expected could happen. The composite traded above the 200-day moving average line (green) briefly a couple of weeks ago, but has since struggled to get above it. In fact, the 200-day line was the reason the composite topped out on Monday and then again on Thursday. It's a flashback from early June and mid-May.
The net result was a move back under the 10- and 20-day moving average lines (red and blue, respectively). Of course, we also fell back under those two moving average lines earlier in the week, only to bounce right back above them. So, we're not going to take this bait just yet. If the NASDAQ falls back under its 50-day moving average line (purple) then we'll get fully in the bearish camp.
With that being said, there are two other things to mention here. First of all, take a look at how sad the volume was all of last week. That's the liability -- that no trend in any direction is going to take off with so few players. Still, a lack of players might potentially mean the composite drifts enough in a single direction to be trade-worthy, even if painfully slow.
The other thing we want to mention is the VXN. It's also starting to move higher, albeit almost imperceptibly. There's something of a ceiling for the VXN around 24.65. If it cracks that line, that could be bigger trouble for the market.
NASDAQ Composite Chart - Daily 
S&P 500
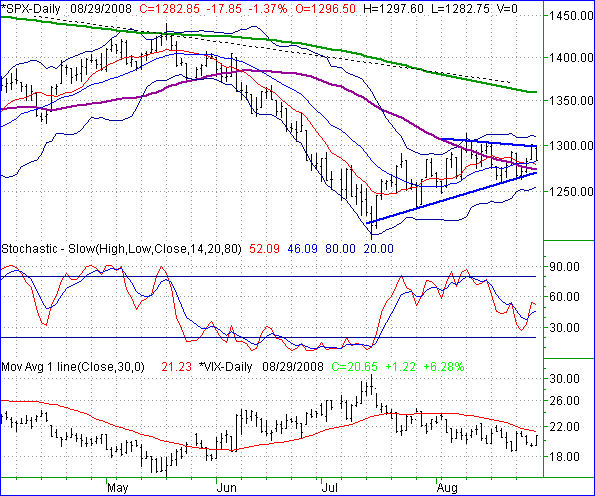
The Standard & Poor's 500 index sank 17.85 points on Friday (-1.37%), closing at 1282.85. That was 9.35 points below the previous Friday's close (-0.72%). Yet, and unlike the NASDAQ, you could still make a fairly bullish argument for the SPX.
Specifically, the S&P 500 still closed above its 10- and 20-day moving average lines (red and blue, respectively). So, we have to be at least a little bit bullish.
Nevertheless, clearly there's a great deal of congestion here; the S&P 500 has been range bound since early August, and even the 50-, 20-, and 10-day moving average lines are all very entangled around 1277. Point being, though we're on the bullish side of the fence, this is mostly a stale index.
Last week he had plotted a wedge shape for the S&P 500 with bright blue lines. Since then we've had to raise and lower those lines to accommodate last week's volatility, even though there was no real net movement. That support and resistance is still the key to the market's next move. The resistance is at 1300, while support is at 1270, just under all those moving average lines. Look for a breakout of that zone.
As for the VIX, it did not move up all that firmly last week, but there is a modest pressure to push it higher now.
S&P 500 Chart - Daily 
Dow Jones Industrial Average
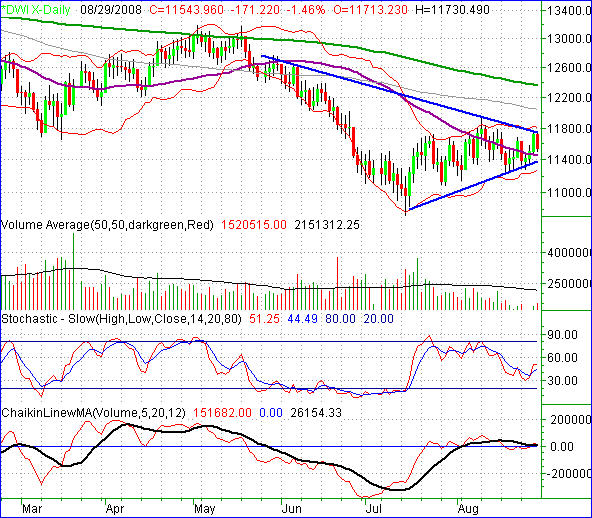
If the S&P 500 was indecisive, then the Dow really is. We've also adjusted the blue chip index wedge (blue lines) to accommodate last week's up and down action. However, the Dow's range-bound fever may be just as well defined by its Bollinger bands (thin, red). Both have been reversal points since early July. Either way, right now the index is just spinning its wheels... perhaps a function of the lack of volume.
In any case, the Dow fell by 171 points on Friday (-1.46%), but only lost 84.1 points for the week (-0.72%) to end the week at 11,543.96. That was the best - or least bad - performance from any of our charts.
Dow Jones Industrial Average Chart - Daily 
Price Headley is the founder and chief analyst of BigTrends.com.