Professional trader Price Headley analyzes the Dow, S&P, and Nasdaq stocks indices.
This is an analysis of the major markets from a technical perspective. I'm using the SPY, QQQQ, and DIA ETF's as a proxy for the S&P 500 Index, NASDAQ 100 Index, and the Dow Jones Industrial Average.
S&P 500 Index (SPY)
If you examine the following chart, you can see that the SPYders have remained in a tight range since mid-July. They basically have been range-bound between 1250 and 1300, which equals about a 4% price range over the past month. This appears to be somewhat of the "Summer Doldrums" effect combined with a Post-Olympics hangover. Market volume has been very low recently as well. The Middle Acceleration Band and 40-Day Exponential Moving Average are also keeping the Index constrained around current levels. Should this range be broken, the first upside potential target remains around the 1325 area, downside targets are 1225 and 1200. A Percent R break back above the key 80 level would be a good sign that an upside breakout will have legs.
S&P 500 Index Daily Chart (SPY) 
NASDAQ 100 Index (QQQQ)
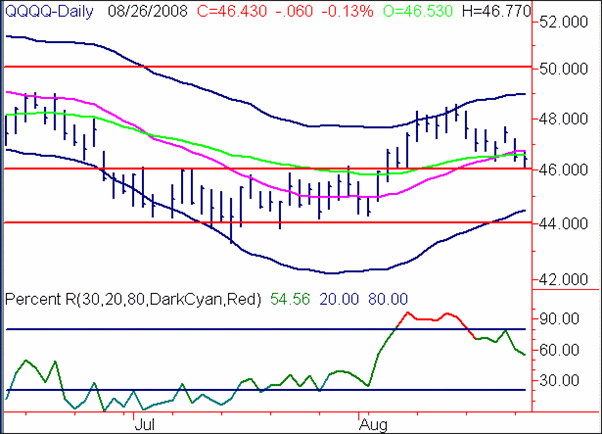
The QQQQs have been stronger than the other major indices, and have currently pulled back to key support around the 46 level. The previous top of its former range should now provide downside support to form a new base level. The QQQQ's are currently just below their Middle Acceleration Band and 40-Day Exponential Moving Average. I would like to see them clear back above these key levels to confirm that we have bottomed out here.
NASDAQ 100 Index Daily Chart (QQQQ) 
Dow Jones Industrial Average (DIA)
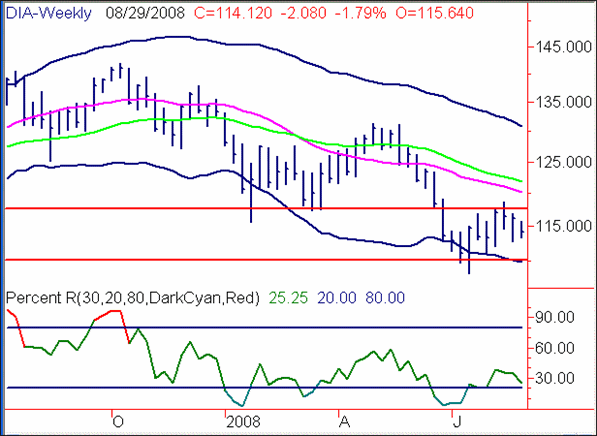
Stepping back to examine the longer-term weekly DIAmonds chart below, you can see that we are basically range bound between the 11,000 and 11,750 area. The good news is that 11,000 is the current location of the Bottom Acceleration Band, and should contain any pullbacks. However, upside potential appears to face resistance around the round 12,000 level, which is also the location of the Middle Acceleration Band and 40-Week Exponential Moving Average. In addition, the DIA has basically remained in the bottom half of its Weekly Bands since Fall 2007, which indicates an underlying bearish trend to me.
Dow Jones Industrial Average (DIA) Weekly Chart 
Price Headley is the founder and chief analyst of BigTrends.com.