Technical Overview
- Euro tests bids below 1.2200
- British pound eyes 1.8000 bids
- Japanese Yen fails to hold 110.00
Market Outlook
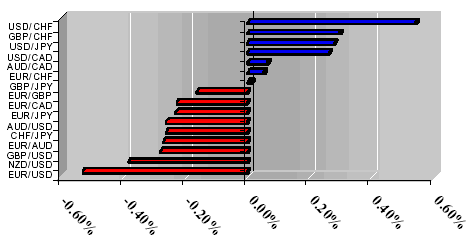
Dollar once again showed that you can’t keep the good currency down as the retrace and consolidation of the recent gains made by the greenback were unsuccessfully challenged by the majors. As the European side continues to decline, the Antipodeans are high enough to probably establish a long term short position for anyone looking to for a long-term trade and is a US dollar bull.
1-Day Currency Pair Outlook
EUR/USD – Euro bulls once again were in full retreat as their counteroffensive met with the same success as the “Battle of the Bulge”. As greenback longs reestablish control over the price action, their initial advance against the single currency bulls will most likely see the pair head lower and test the 1.2200 figure, thus breaking below the 1.2247, a 50-day SMA that gave the euro bulls support during their counterattack. As dollar longs continue to press their advance, the next move to the downside will most likely see the greenback take on the euro defenses around 1.2126, a level marked by the August 19 daily low, with collapse of the single currency defenses seeing the pair head toward the psychologically important 1.2000 handle. Indicators are beginning to diverge with momentum indicator dipping below the zero line and MACD sloping downward toward the zero line. Oscillators remain in a neutral territory, giving the dollar longs enough room to expand their territory before the pair enters oversold territory.
Key Levels & Technical Indicators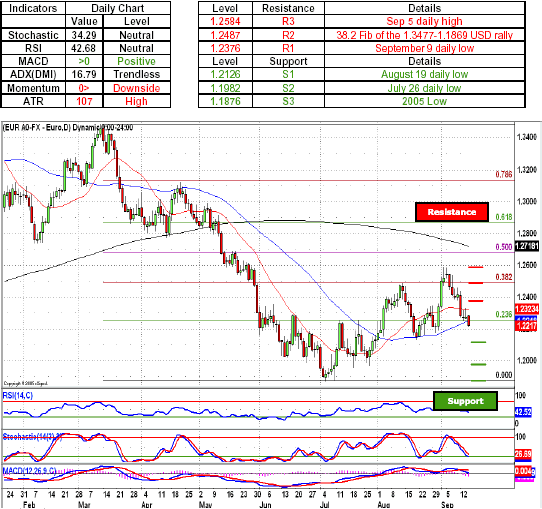
USD/JPY – Japanese Yen longs once again tested their luck as they tried to reestablish their dominance and pushed the pair toward the psychologically important 110.00 figure. Following the initial shock of the retrace, greenback longs gathered their forces and pushed the vanguard yen longs back toward 110.50 mark, which currently stands in the way of the dollars advance toward the 50-day SMA at 110.90. A break above the 111.00 will most likely see the dollar longs push their way toward 111.48, a level marked by the 23.6 Fib of the 104.18-113.74 USD rally. A sustained momentum of the dollar push will most likely see the fall of 112.62, a defensive position established by the August 8 daily spike high and a gateway to the 2005 high at 113.68. A break above the 113.68 will most likely open the psychologically important 115.00 handle as a potential target as a break above that will most likely see a long term trend heading toward the 120.00 figure. Indicators are beginning to diverge, with momentum indicator above the zero line and MACD sloping upward toward the zero line, while neutral oscillators give greenback bulls enough room to maneuver.
Key Levels & Technical Indicators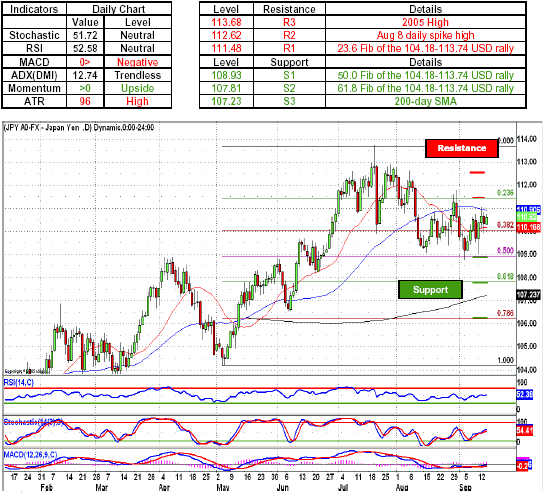
GBP/USD – British pound bulls where so close and yet so far when they approached the 1.8300 figure in hopes of reestablishing themselves after managing to push back the greenback longs, only to find themselves tumbling below the 1.8200 line and testing the bids around 1.8150, a level marked by the 20-day SMA. A further break in the pound defenses will most likely see the sterling further lose its shine as pair heads south toward the 1.8032, a level marked by the 38.2 Fib of the 1.9214-1.7283 USD rally, which currently protects the psychologically important 1.8000 figure. A fall of the 1.8000 figure will signal a run toward the 1.7886, a defensive position established by the pound longs using the 50-day SMA. Indicators are signaling weakening trend conditions as ADX declined to 25.35, while both MACD and momentum indicator above the zero line and both oscillators treading below the overbought line.
Key Levels & Technical Indicators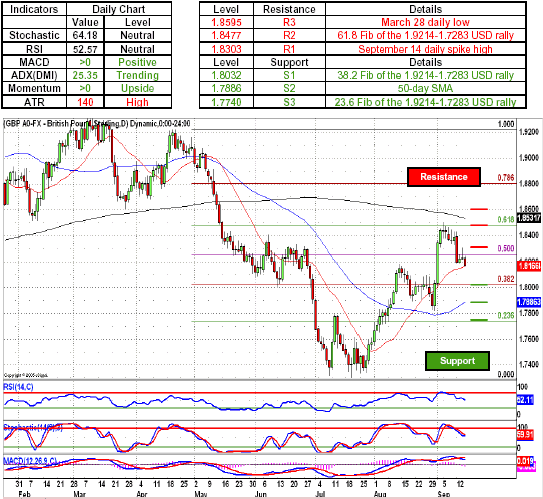
USD/CHF – Swiss Franc longs tried and tried again to force their way below the psychologically important 1.2500 handle, only to find a rush of bids coming into the market as greenback bulls took the advantage and knocked the advancing Swissie longs back. As the pair climbs above the 1.2700 figure and take out the CHF defenses at 1.2705, a level marked by the 23.6 Fib of the 1.1492-1.3085 USD rally, the next move by the dollar longs will most likely see the Swiss Franc defenses around 1.2786, marked by the August 24 daily high, crumble like a sand castle as the greenback longs currently keeping the psychologically important 1.3000 handle firm in their sights. An advance toward the 1.3000 will most likely has to contend with 1.2922, a last line of defense established by the Swiss Franc longs, before dollar longs can take on the big level. Indicators beginning to diverge as the Swissie longs fell out of favor with momentum indicator treading above the zero line and MACD sloping to the upside below the zero line. Oscillators remain neutral with both RSI and Stochastic giving the greenback bulls enough breathing room.
Key Levels & Technical Indicators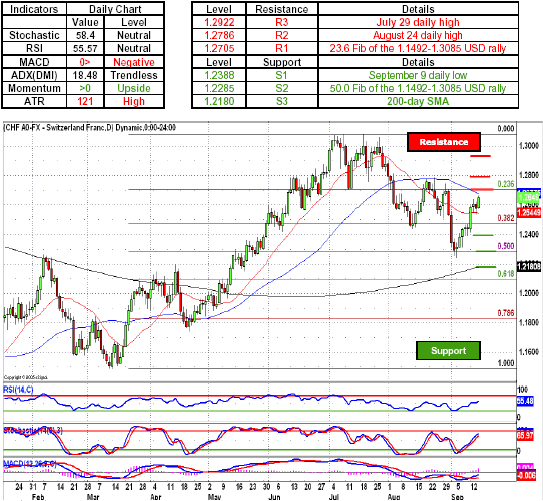
USD/CAD – Canadian dollar bulls continued to engage the US dollar counterpart in a starring contest as with any contest to victor goes the spoils and in this case the dominance over the price action. As both sides get ready to prove their worth, a move to the upside will most likely see the Loonie longs retreat toward the 1.1900 figure, with a break to the upside testing the CAD defenses at 1.1935, a 78.6 Fib of the 1.1720-1.2733 USD rally, which is further reinforced by the 20-day SMA. Retaliation on the part of Loonie longs will most likely see the greenback retreat toward the 1.1720, a low made by the Canadian dollar bulls during the November of 2004. Indicators are beginning to favor greenback traders with Stochastic and RSI climbing above the oversold level, while MACD and momentum indicator below the zero line continue to support the Loonie traders.
Key Levels & Technical Indicators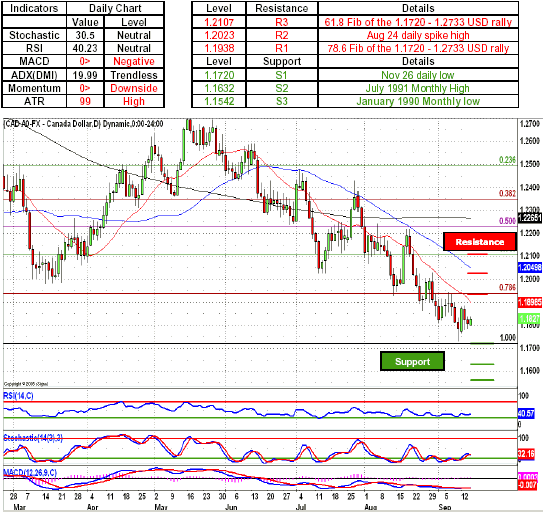
AUD/USD – Australian dollar longs continued to seesaw around the .7700 figure as the pair started to slowly give under its own weight. As Aussie longs finally realize that its time to head south, the next move by the greenback longs will most likely see the pair head below .7678, a level established by the 50.0 Fib of the of the .7991-.7374 USD rally, which is further reinforced by the 200-day SMA. A further collapse of Aussie defenses will most likely see the US dollar bulls push the Australian dollar longs toward the .7604, a 38.2 Fib of the .7991-.7374 USD rally a level that is further reinforced by the 20-day SMA. A further advance by the US dollar longs will most likely see the Aussie head toward the psychologically important .7500 handle. Indicators signal a move to the downside with Stochastic treading above the overbought line, while positive MACD and momentum indicators continuing to favor Aussie longs.
Key Levels & Technical Indicators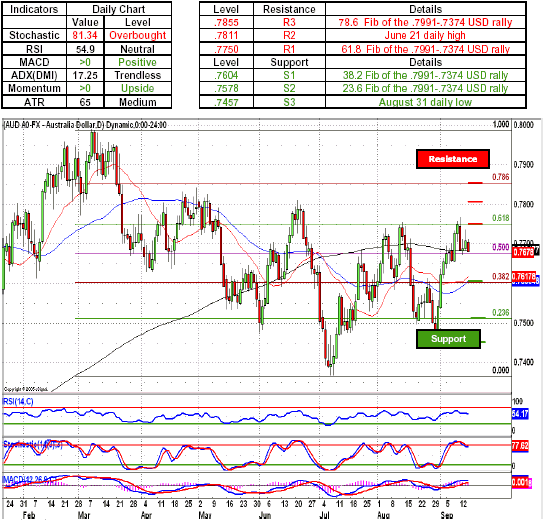
NZD/USD – New Zealand dollar bulls decided to delay their departure to the southern hemisphere and made a sharp dash above the .7100 line, only to find themselves on the wrong side of the trade as greenback longs filled the Kiwi’s demand for offers. As the price action remain to normal and US dollar longs reassert their momentum and push the New Zealand dollar bulls toward the psychologically important .7000 handle, a break below will most likely see the pair tumble through the Kiwi’s defenses at .6986, marked by the key 38.2 Fib of the .7468-.6681 USD rally. A sustained momentum on the part of the greenback longs will most likely see the pair head toward the .6873, a 23.6 Fib of the .7468-.6681 USD rally. Indicators remain supportive of the New Zealand dollar bulls, with both MACD and momentum indicator above the zero line, while Stochastic dipping back below the overbought line adds to the outlook that Kiwi has reached the end of its travel above .7000 territory.
Key Levels & Technical Indicators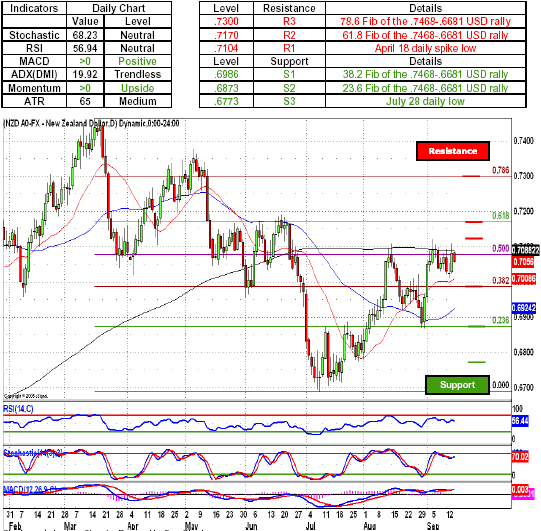
Sam Shenker is a Technical Currency Analyst for FXCM.