Monday afternoon's resilience of GLD and GDX suggests to Deron Wagner their multi-month patterns of failed breakouts and unpredictable opening gap downs are probably finished.
Stocks closed out the second quarter of the year with little fanfare yesterday, as the major indices finished with mixed results. The broad market feebly attempted to rally in the morning, then drifted back down in the afternoon. Weakness in the tech arena caused the Nasdaq Composite to fall 1.0% and suffer its third straight day of losses. The S&P 500 eked out a gain of 0.1%. The Dow Jones Industrial Average was unchanged. Small and mid-cap stocks showed relative weakness alongside of the Nasdaq. The Russell 2000 and S&P Midcap 400 indices shed 1.2% and 0.5% respectively. The Nasdaq Composite closed at its dead low of the day, while both the S&P 500 and Dow Jones Industrial Average settled near the bottom third of their intraday ranges. Sustaining its worst monthly losses in nearly six years, the S&P 500 plummeted 8.6% in June. The Nasdaq Composite similarly shed 9.1%. Blue chips fared the worst, as the Dow Jones Industrial Average tumbled 10.4%.
Turnover eased across the board, indicating a bit of apathy among traders. Total volume in the NYSE was 4% lighter than the previous day's level. Trading in the Nasdaq declined 10%. Despite the slightly higher closing price of the S&P 500, declining volume in the NYSE marginally exceeded advancing volume. The Nasdaq adv/dec volume ratio was negative by approximately 3 to 1.
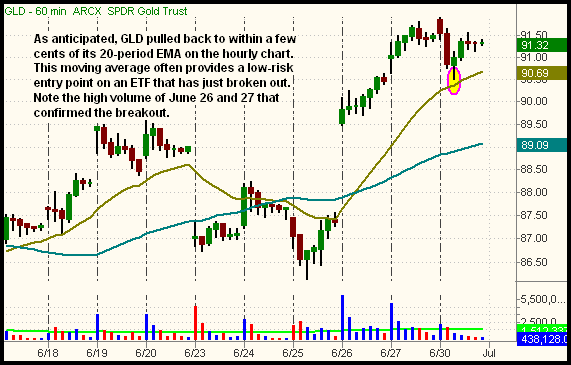
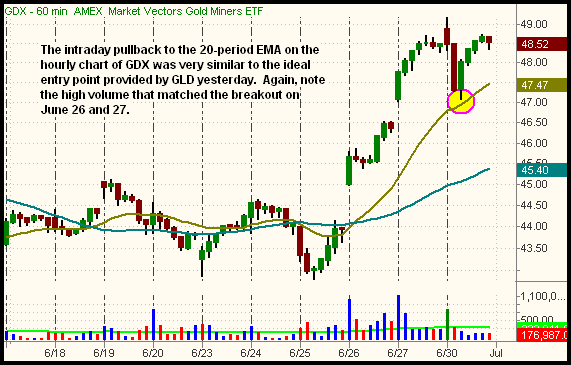
In yesterday's Wagner Daily, we proposed the idea of buying the StreetTRACKS Gold Trust (GLD) and/or Market Vectors Gold Miners (GDX) on pullbacks to their 20-period exponential moving averages on the hourly charts. Recently, we also wrote a mini-lesson discussing how reliably ETFs can be bought on their first pullback to that moving average after they break out. Astute short-term traders who paid attention to yesterday morning's GLD/GDX detailed entry suggestion were subsequently rewarded with the ideal buy point later in the afternoon. Looking at the hourly charts of GLD and GDX below, notice how both ETFs perfectly pulled back to nearly touch support of their 20-EMAs at mid-day, then resumed their recent bullish momentum in the afternoon: 

Though we provided the parameters for ideal daytrades in GLD/GDX, we did not "officially" buy either ETF because of their recent patterns of nasty opening gap downs. However, since June 26, there have been decidedly stronger trends in the precious metals ETFs. The afternoon resilience of GLD and GDX tells us their multi-month patterns of failed breakouts and unpredictable opening gap downs are probably finished. Looking ahead, the most ideal scenario would be for the gold (and possibly silver) ETFs to consolidate in a tight, sideways range for the next several weeks. If they do, the first breakout above their ranges would be buyable for an intermediate-term trade, not just a quick, momentum-based pop.
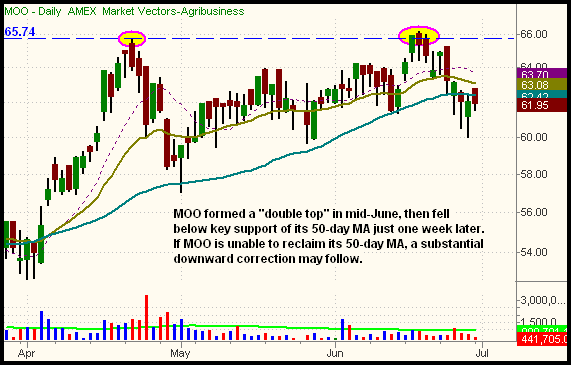
Agriculture and fertilizer stocks have been on fire for the past year, but those of you with long-term positions may consider tightening stops to protect your gains. A few leading stocks within the sector have begun to show near-term relative weakness, giving investors an early heads-up that a significant correction may be coming soon. As a proxy for the sector, check out the daily chart of Market Vectors Agribusiness (MOO), which is comprised of forty individual stocks related to various areas of agribusiness: 
Looking at the chart above, notice that MOO formed a "double top" formation in mid-June. It then sold off to close below its 50-day moving average (the teal colored line) last week. MOO attempted to quickly reclaim its 50-day MA by gapping higher on yesterday's open, but notice how it sold off to close below its 50-day MA again. With MOO only 6% below its all-time high, it's still too early to call a definitive top. Nevertheless, agribusiness bulls should certainly be cautious with any open long positions. Downside momentum in this sector could be fast and furious if the correction picks up steam.
Thinking about selling short MOO? If so, agressive traders might consider selling short MOO on a break below yesterday's low, while placing a protective stop above the 20-day EMA (63.08). In this case, it is crucial to at least wait for a break below yesterday's low. More risk averse traders who still like the trade idea could simply wait for a breakdown below the June 27 low, then sell short the first subsequent bounce into resistance. Yet another scenario is to scale into a short position by entering partial share size below yesterday's low, then adding to the position on a break below the June 27 low. This enables one to "dip a toe in the water" without falling in the deep end of the pool. Be warned, however, that MOO is now out of sync with the broad market by showing newfound relative weakness as the main stock market indexes may soon attempt to bounce from an "oversold" state. Perhaps short entries into MOO are best handled on an intraday basis until we see how it reacts when the broad market eventually bounces.
As objectively illustrated in yesterday's commentary, the S&P 500 is trying to decide whether or not it wants to hold at major support of its 38.2% Fibonacci retracement level, which coincides with the low of March. If it follows the path of its brethren Dow Jones Industrial Average, a breakdown to a new 52-week low could be coming soon. On the other hand, traders have the perfect excuse to start buying stocks at current levels, but we need to see the proof first. Capital preservation is key in this highly volatile environment, so there's absolutely nothing wrong with sitting on the sidelines, preserving cash for the next low-risk opportunity that comes along. As always, remember to trade what you see, not what you think!
Open ETF positions:
Long - (none)
Short - SLX
Deron Wagner is the Founder and Head Trader of both Morpheus Capital LP, a U.S. hedge fund, and Morpheus Trading Group, a trader education firm launched in 2001 that provides daily technical analysis of the leading ETFs and stocks. For a free trial to the full version of The Wagner Daily or to learn about Wagner's other services, visit MorpheusTrading.com or send an e-mail to deron@morpheustrading.com.