The broad market remains firmly in a downtrend over the long-term, but tradable, counter-trend retracements often lead to sizable gains in a bear market.
Stocks wrapped up a whippy, seesaw week on a positive note last Thursday, ahead of the three-day holiday weekend. The major indices opened slightly lower, grinded their way higher throughout the morning, then saw more substantial buying interest in the afternoon. The S&P 500 climbed 2.4%, as both the Nasdaq Composite and Dow Jones Industrial Average gained 2.2%. The small-cap Russell 2000 and S&P Midcap 400 indices were higher by 2.6% and 1.9% respectively. Making up most of the previous day's losses, the main stock market indexes closed at their intraday highs, and near their best levels of the week.
Volume finally showed impressive signs of life last Thursday, though much of the expansion in turnover was likely attributed to the "quadruple witching" options expiration day. Total volume in the NYSE surged 28% above the previous day's level, while volume in the Nasdaq rose 16%. It was the most active day in the NYSE of the past two months. Considering that volume levels have been unimpressive on recent days of gains, it was quite positive that trading picked up so much. The confirmed "accumulation day" in both exchanges tells us that institutions such as mutual funds and hedge funds, rather than just retail investors, were behind last Thursday's rally. This is one sign we've been waiting for in order to confirm the stock market's recent reversal attempt. Still, the simultaneous expiration of stock index futures, stock index options, stock options and single stock futures was undoubtedly responsible for a significant part of the volume increase.
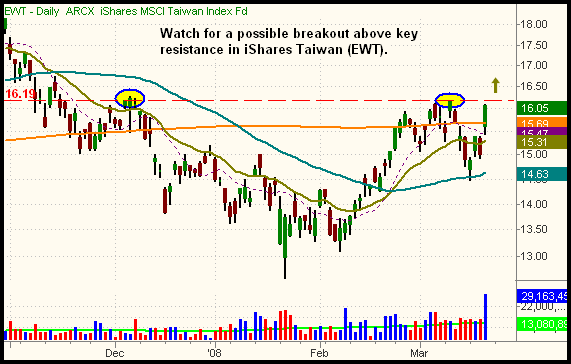
One international ETF that caught our attention last Thursday was the iShares Taiwan Index (EWT). After bouncing off new support of its 50-day MA early last week, it finished the week by cruising back above its 200-day MA. It also did so on more than double its average daily volume, indicating the presence of institutional buying. Below is the daily chart of EWT: 
In the coming days, we expect EWT to rally above the horizontal price resistance illustrated above. A rally above the March 11 high would be bullish, as EWT has already begun showing clear relative strength to most international ETFs. Speculation as to the outcome of Taiwan's presidential election was probably responsible for much of last Thursday's gain. Nevertheless, we trade based on technical analysis, not speculation of news events. The reason a stock or ETF moves up or down is largely irrelevant to us. All that matters is the ultimate price action and volume patterns.
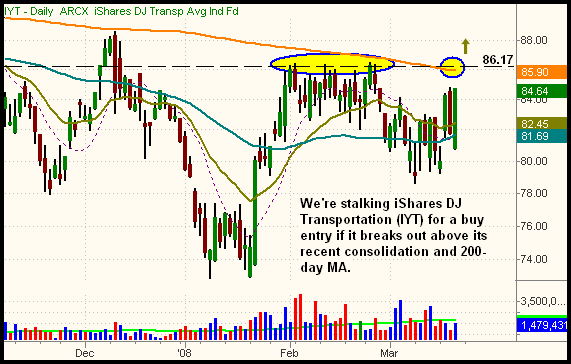
If the U.S. market builds on last week's gains, keep an eye on the transportation sector. The iShares DJ Transportation Average (IYT), for example, may be ready to break out above a lengthy base of support that converges with its 200-day MA. This is illustrated on the daily chart below: 
If IYT closes above its 200-day MA, it will also have broken out above resistance of its prior highs from February. That could lead to substantial gains in the short to intermediate-term. We'll be monitoring the action in IYT (and a few other transportation ETFs) for a possible buy entry and will send an Intraday Trade Alert to subscribers if we decide to buy it.
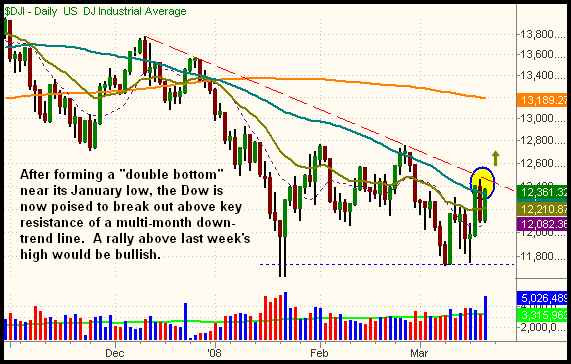
Aided largely by the formation of "double bottom" patterns at their prior lows from January, the main stock market indexes turned in solid gains last week. Further, the S&P 500, Nasdaq Composite, and Dow Jones Industrial Average each closed above their 20-day exponential moving averages. The Dow even managed to reclaim its 50-day moving average, though not by a wide margin. Taking a look at the daily chart of the Dow below, notice how the index is also poised to break out above resistance of a three and a half month downtrend line: 
A closing price above last week's high of 12,461 would mark a breakout of the downtrend line shown above. The S&P 500 also has a similar downtrend line near resistance of its 50-day MA. With overall volume levels picking up, "double bottoms" formed off the January lows, and closing prices above the 20-day EMAs, this combination of factors could lead to decent upside momentum in the intermediate-term. Recent rally attempts have been very short-lived, but the technical situation is right for a more sustainable bounce this time. The broad market remains firmly in a downtrend over the long-term, but tradable, counter-trend retracements often lead to sizable gains in a bear market. The key is taking profits on positions before the intermediate-term bounce runs out of gas. As always, we'll keep subscribers updated daily by merely "trading what we see, not what we think."
Open ETF positions:
Long - QLD, DUG
Short - (none)
Deron Wagner is the Founder and Head Trader of both Morpheus Capital LP, a U.S. hedge fund, and Morpheus Trading Group, a trader education firm launched in 2001 that provides daily technical analysis of the leading ETFs and stocks. For a free trial to the full version of The Wagner Daily or to learn about Wagner's other services, visit MorpheusTrading.com or send an e-mail to deron@morpheustrading.com.