The S&P, Nasdaq, and Dow are now marginally above their 20-day moving averages, but still below key resistance of their February 1 highs.
Stocks snapped back from the previous afternoon's weakness by rallying above Tuesday's highs, but the advance lacked the confirmation of higher turnover. The Nasdaq played "catch up" yesterday, zooming 2.3% higher. The small-cap Russell 2000 scored an identical 2.3% gain, while both the S&P 500 and Dow Jones Industrial Average climbed 1.4%. The S&P Midcap 400 gained 1.3%. This time, the major indices managed to close at or near their intraday highs.
Unfortunately for the bulls, volume levels failed to rise alongside of prices. Total volume in the NYSE declined 6%, as volume in the Nasdaq was unchanged from the previous day's level. The S&P 500 has advanced in each of the past three sessions, but trading limped in below average levels in each of those sessions. Because the market's recent gains have lacked the confirmation of accumulation by mutual, hedge, and pension funds, this week's rally remains highly suspect. When a market rallies on lighter than average volume, it only takes one day of institutional selling to wipe out many days of gains. With the stock market clearly stuck in an overall downtrend, there are pretty good odds of another day of institutional selling coming along shortly.
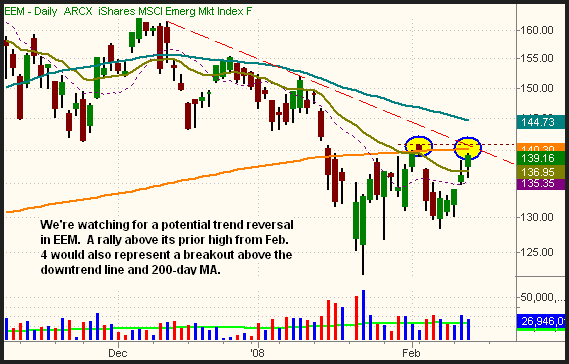
After moving steadily lower since October of 2007, the iShares Emerging Markets Index (EEM) may be poised to reverse its bearish momentum and breakout above its primary downtrend line. Take a look at the daily chart: 
EEM formed a "higher low" on February 7, and is now testing resistance of its prior near-term high from February 4. If EEM breaks out above that level, it will also coincide with a rally above both its multi-month downtrend line and its 200-day moving average. A breakout above three such significant areas of technical resistance would likely lead to further upside momentum in EEM. However, as always, be sure to avoid buying ahead of the actual breakout. For the lowest risk, wait for EEM to close above $141, not merely probe above it on an intraday basis.
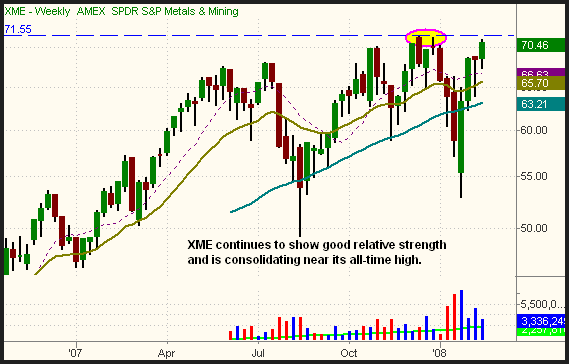
A few days ago, we pointed out the relative strength in the S&P Metals and Mining SPDR (XME). On February 12, XME pulled back sharply after testing resistance of its prior high, but it cruised right back up yesterday. A rally above the February 12 high would send XME into new high territory, thereby eliminating all price resistance. In a bull market, new highs are obviously common, but it's a rarity right now. The weekly chart of XME below illustrates the potential breakout: 
In yesterday's Wagner Daily, we explained that a break of the February 12 lows would generate triggers for entry on the short side of the broad market. Although stocks rallied yesterday, the technical picture didn't improve much. The S&P, Nasdaq, and Dow are now marginally above their 20-day moving averages, but still below key resistance of their February 1 highs. With this week's rally lacking the punch of higher volume, we continue to believe it's dangerous to be heavily positioned on the long side of the market. As long as the market continues to show strength, there's nothing wrong with having a few long positions. But when the market inevitably begins to resume its primary downtrend, be sure to quickly deploy disciplined stop losses. We're now looking at a breakdown below yesterday's lows to trigger short sales in the broad-based indexes.
Open ETF positions:
Long - DBC, UNG
Short - (none)
Deron Wagner is the Founder and Head Trader of both Morpheus Capital LP, a U.S. hedge fund, and Morpheus Trading Group, a trader education firm launched in 2001 that provides daily technical analysis of the leading ETFs and stocks. For a free trial to the full version of The Wagner Daily or to learn about Wagner's other services, visit MorpheusTrading.com or send an e-mail to deron@morpheustrading.com.