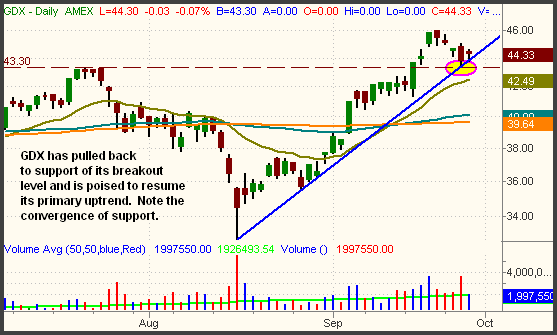
If the Market Vectors Gold Miners (GDX) moves above yesterday's high, Deron Wagner expects a resumption of the primary uptrend.
Stocks built on their previous day's gains yesterday, but it was another choppy, range-bound session. Both the S&P 500 and Nasdaq Composite gained 0.4%, while the Dow Jones Industrial Average ticked 0.3% higher. The small-cap Russell 2000 and S&P Midcap 400 indices rallied 0.6% and 0.8% respectively. Although the major indices finished near their intraday highs, both the S&P and Dow their tightest trading ranges since their consolidations began last week. Most of yesterday's gains were the result of an opening gap up in the broad market. As such, not a lot can be read into yesterday's broad market action.
Total volume in the NYSE eased 9%, as volume in the Nasdaq registered 13% below the previous day's level. Considering the lack of intraday direction in the stock market yesterday, it's not surprising that turnover was also lighter. Higher trading levels usually translate to steadier intraday trends, whether up or down. In both exchanges, advancing volume exceeded declining volume by just under 2 to 1.
With the impressive strength in the price of spot gold over the past month, the Market Vectors Gold Miners (GDX), comprised of a basket of individual gold mining stocks, has scored solid gains as well. Now that spot gold is finally taking a rest, GDX has pulled back slightly as well. However, the pattern on its daily chart is still quite bullish, pointing to a potential entry point above yesterday's high. Take a look: 
Two days ago, GDX pulled back to test support of its breakout to a new 52-week high (the dashed horizontal line). It firmly held the test of support, then traded in a narrow range yesterday. Support of the primary uptrend line off the August low (the ascending blue line) is now providing key support as well. If GDX moves above yesterday's high, we can expect a resumption of the primary uptrend, as it will break out above resistance of its short-term downtrend line from the recent high.
As the hourly uptrend lines in the S&P and Dow have held up for the past several days, many of the major indices are now forming rather bullish looking consolidations on their hourly charts. If these patterns follow through, it could lead to high momentum breakouts in the stock market sometime next week. But despite the tight consolidations that have formed since the Fed-inspired breakout, there remains valid reason to be cautious.
We've learned from experience that chart patterns that look too obvious and clear rarely follow through without first shaking out the "weak hands." Since the September 18 breakout, stocks have simply not experienced any substantial "shakeout" action. This, of course, does not mean that the market must have a shakeout before breaking out above the range, but such price action would make a subsequent breakout all the more likely to hold up. Breakouts without prior shakeouts often turn out to be fakeouts. Get it? Got it? Good!
Open ETF positions:
Long - LQD
Short - (none)
Deron Wagner is the Founder and Head Trader of both Morpheus Capital LP, a U.S. hedge fund, and Morpheus Trading Group, a trader education firm launched in 2001 that provides daily technical analysis of the leading ETFs and stocks. For a free trial to the full version of The Wagner Daily or to learn about Wagner's other services, visit MorpheusTrading.com or send an e-mail to deron@morpheustrading.com.